|
|
eSense Pulse ManualVersion 7.1.3 | created at 07/20/2026 |
|
|
|
eSense Pulse ManualVersion 7.1.3 | created at 07/20/2026 |
|
ContentsGeneral1. News 2. Delivery contents eSense Pulse 4. Comparison measurement eSense Pulse & Faros 180 5. Combination possibilities eSense sensors & Combined Feedback 6. Analysis of eSense data (CSV) 7. Streaming eSense data to a PC/Mac/Browser (eSense Web App, OSC, LSL) 8. Duplicate eSense on a large screen (screen mirroring) 9. Troubleshooting connection problems 10. EC Declaration of Conformity 11. Contact Heart Rate Variability12. General information on heartbeat and heart rate variability 13. Features of the eSense Pulse 14. Explanation of the individual measured values Biofeedback Training15. Introduction to eSense Pulse 16. Operating instructions for the eSense Pulse 17. Heart Rate Variability and Biofeedback Training 18. Procedures 19. Open Training Software & Accessories23. Magic Blue FAQ eSense App (Android / iOS)24. Functions of the Mindfield eSense App 25. General notes 26. General view & Open Training 27. Breath Pacer 29. Spectrogram 31. Pie chart (after the measurement) 33. Procedure editor 34. Add new module 37. Meditations 38. Own media (photos, videos and audios) 39. General settings 40. In App Purchases 43. Marker feature 44. Virtual Reality (VR) (f.i. Meta Quest 3) 45. Compatible Android and iOS devices eSense Web App (www.esense.live)46. eSense Web App 47. Supervisor Guide Account & Cloud (optional)50. Groups 51. Privacy policy 1. NewsWhat’s new in the eSense App 8.x With version 8, the eSense App has received a completely new technical foundation (migration to Capacitor 7). This brings significantly more stability, a streamlined user interface and the basis for faster future updates. In addition, several new features have been added. Latest updates (version 8.1)
New features
Improvements
Manual & FAQ: https://help.mindfield.de 2. Delivery contents eSense Pulse Scope of delivery of the eSense Pulse:
3. Technical DataBluetooth®
ANT+
eSense Pulse:
4. Comparison measurement eSense Pulse & Faros 180It shows a high precision and agreement of the data collected in parallel on one person. The curves lie so exactly on top of each other that the curve underneath in blue is hardly recognizable: 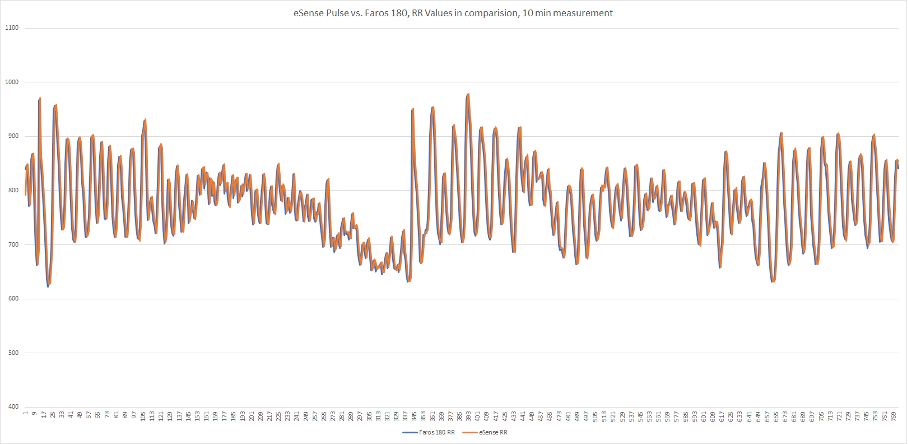 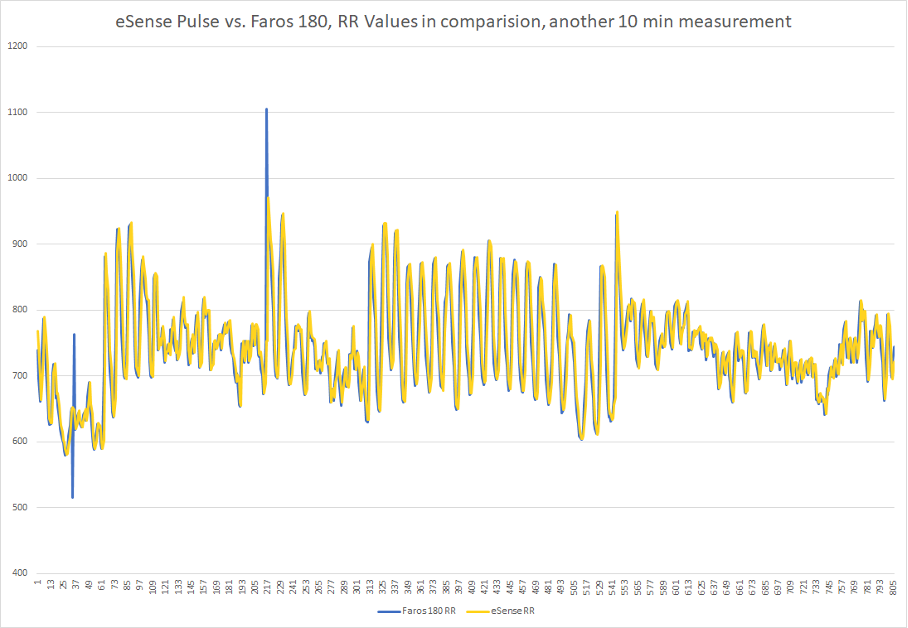 5. Combination possibilities eSense sensors & Combined FeedbackThe eSense sensors can be combined with each other with restrictions. You can use this combination in our eSense app in both an Open Training and a Procedure. Since the eSense Skin Response, eSense Temperature and eSense Respiration each require the 3.5mm headphone jack in your smartphone or tablet, these 3 sensors cannot be combined with each other. The video explains the exact procedure for combining the eSense. The settings in the eSense app are shown and how a later evaluation of the combined measurements can be made. eSense PulseSince the eSense Pulse connects via Bluetooth®, you can combine the eSense Pulse with each of the other sensors (via the 3.5mm headphone jack). This results in the following possible combinations regarding sensors and biofeedback parameters (in brackets):
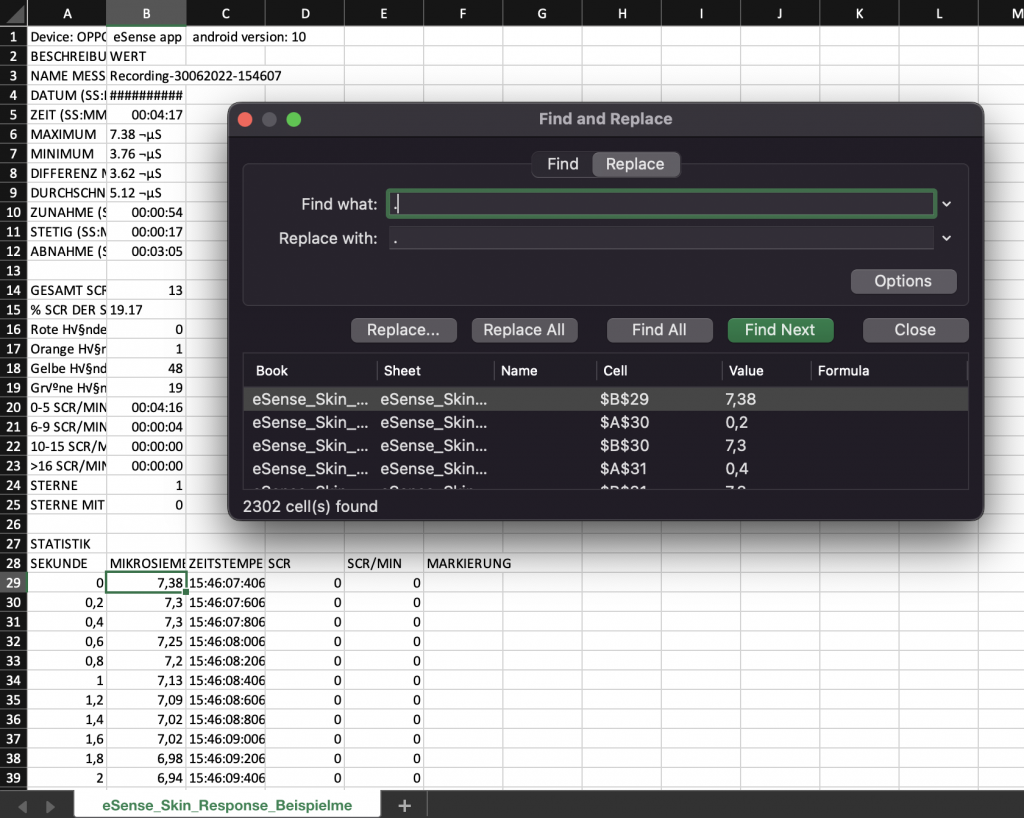
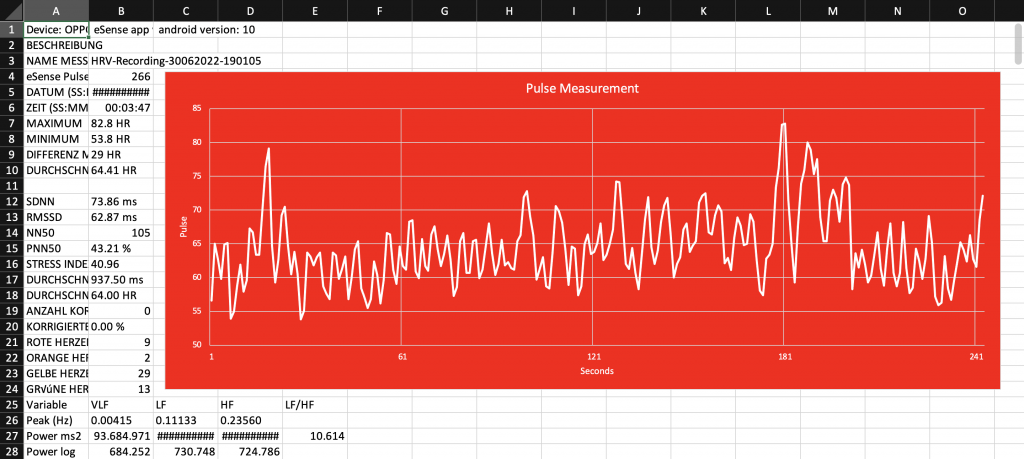
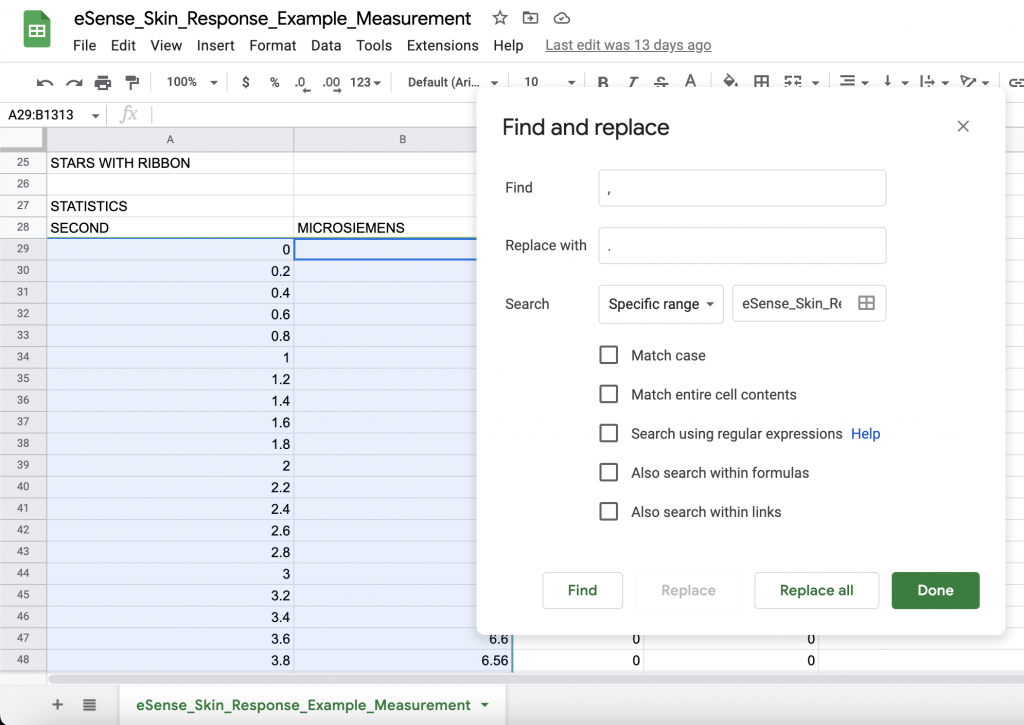
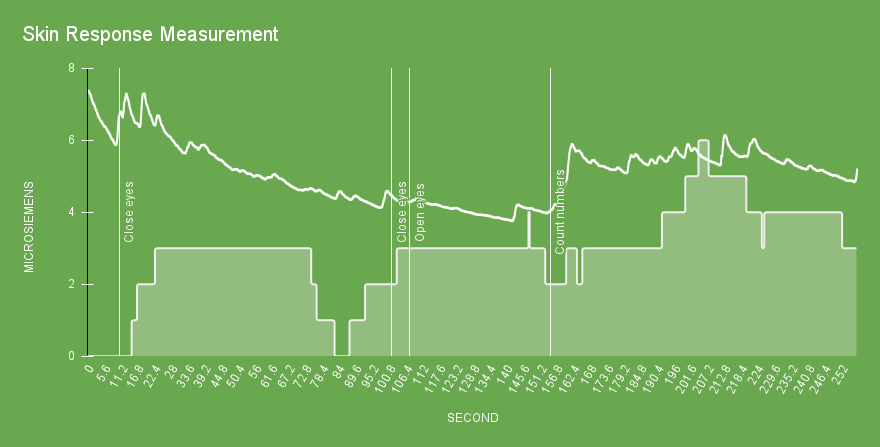
*The eSense Respiration can only be used in combination with the eSense Skin Response, as it is based on the Skin Response. 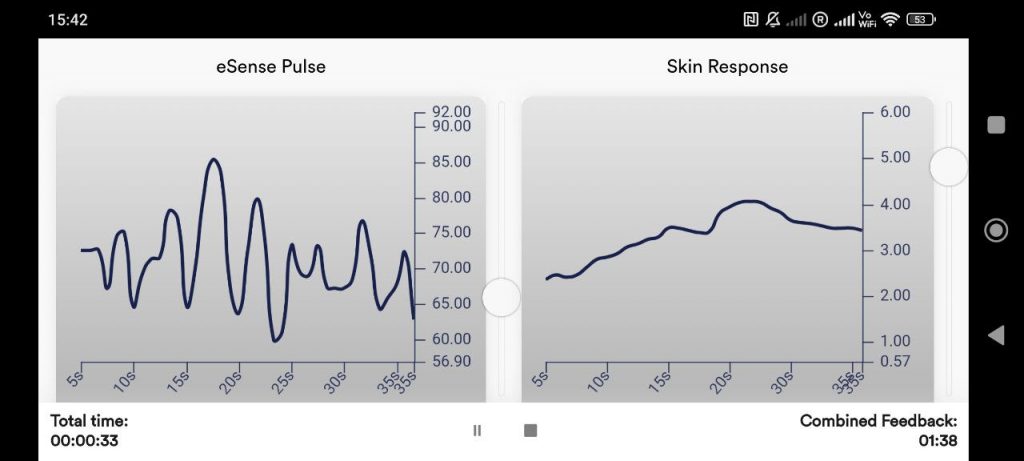 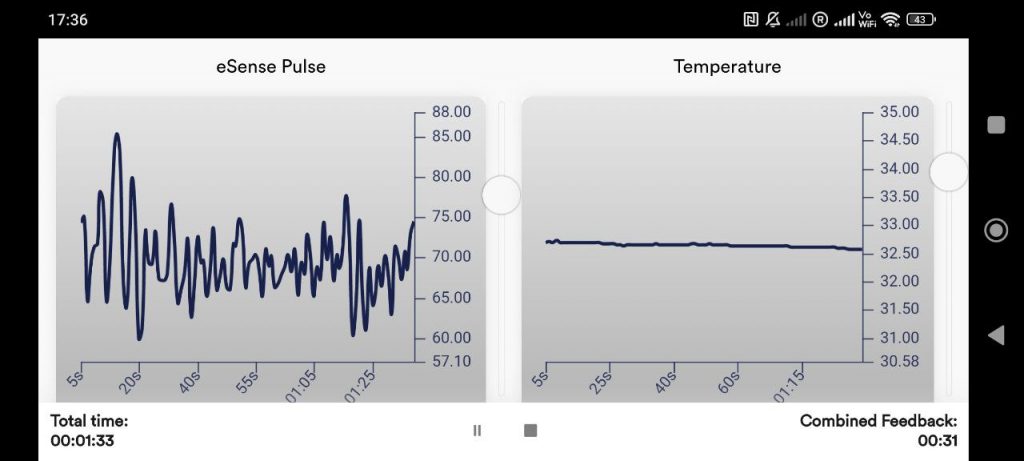 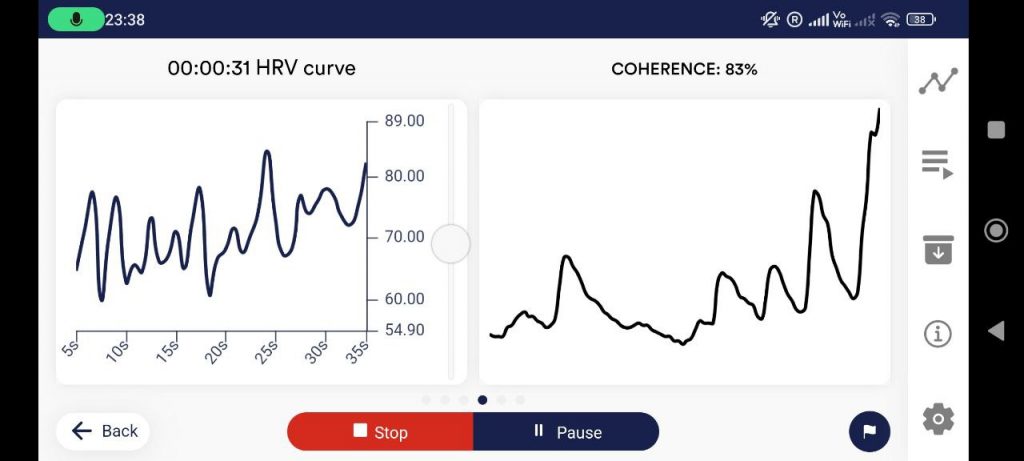 6. Analysis of eSense data (CSV)You can export the data from the eSense app and then further evaluate it with other programs (such as Microsoft Excel™ or Google Spreadsheets™). In this guide we will show you all the steps, from exporting from the eSense app to importing and evaluating in Microsoft Excel™ and Google Sheets™. For the eSense Pulse we also have a complementary article about the Kubios HRV software. The examples shown in this guide are mostly related to the eSense Skin Response. In principle, however, data from the eSense Temperature, eSense Pulse, eSense Respiration or eSense Muscle can be processed in the same way. Exporting measured values from the Mindfield eSense app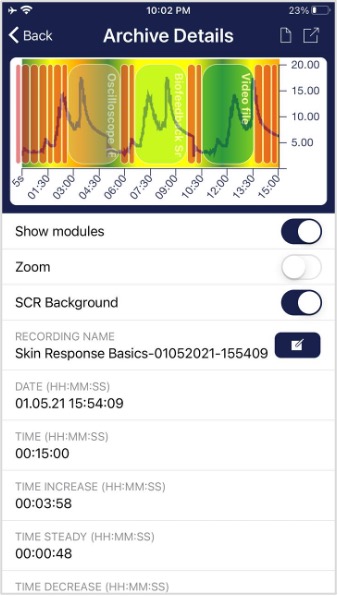 The app also includes an archive where you can save and export your recordings. Export data By tapping on the export icon in the upper right or by tapping the “Export as CSV File” button at the bottom you can export the recordings in .csv format with all common apps (e.g. send via Messenger™, WhatsApp™, email etc.) or simply on your phone or in your cloud (e.g. Google Drive™ or Dropbox™). 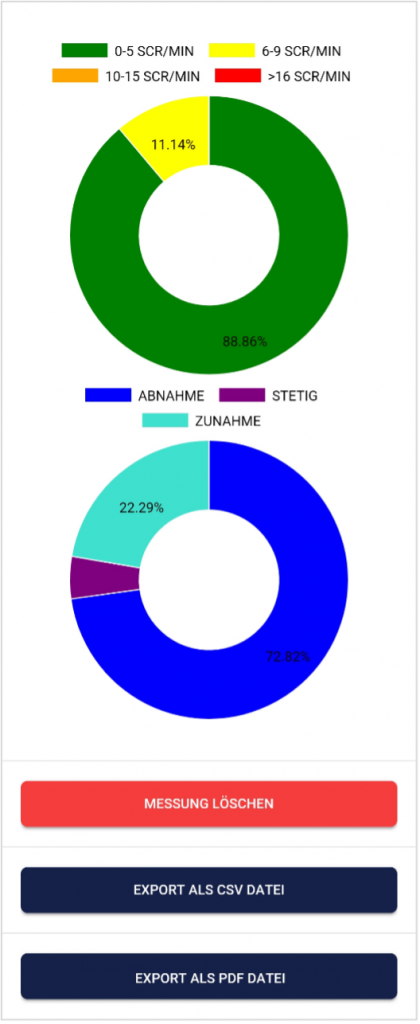 The data is exported as.csv file (comma-separated values). You can open this file format e.g. with Microsoft Excel™ or Open Office Calc™ (free alternative to Excel). If you like working with Google, Google Sheets™ (Google Tabellen™ in German) can also be an alternative to Excel for you. You can also open and visualize your exported.csv files and easily access them from multiple devices via the cloud. Google Sheets has similar functions as Excel and a very similar operation. General NoteThe exported files are always CSV files. CSV stands for “Comma separated values”. This means that a comma separates the values in the file (,). These CSV files can be opened and edited with programs such as Microsoft Excel™, Google Sheets™. It is also possible to import and edit with frequently used programming languages or frameworks such as R™, Python™, Numpy™ or Tensorflow™. These instructions refer to Microsoft Excel™ and Google Sheets™. We recommend beginners to use Google Sheets™ rather than Microsoft Excel™, because it is easier to use and it often works better with our measurements (f.i. the seconds are not automatically prefixed to dates, see in the section on Excel). Google Sheets is also a bit better at quickly creating charts automatically. Using Excel makes more sense if you are already more familiar with Excel. You can find Google Sheets™ here: https://www.google.com/sheets/about/ Your settings at Excel™ and Google Sheets™ are decisive. The eSense app adapts the measured values to the language used. In English, the numbers are usually separated by a dot. Therefore, 1.5 in the English version becomes 1,5 in the German version. So if you open the CSV file with Excel™ or Google Sheets™ and the numbers don’t make sense, it’s usually because of different languages in the eSense app and Excel™ or Sheets™. In principle, therefore, the following applies: If you use Excel™ or Sheets™ in German, you should also use the eSense app in German. If you use Excel™ or Sheets™ in English, you should also use the eSense app in English. This saves you the first two steps (replacing decimal separators and splitting values into columns) and you can start directly with step 3 (Apply skin conductance against time). Microsoft Excel™1. Replace decimal separator (only necessary if you have different language settings in Excel™ and the eSense app)
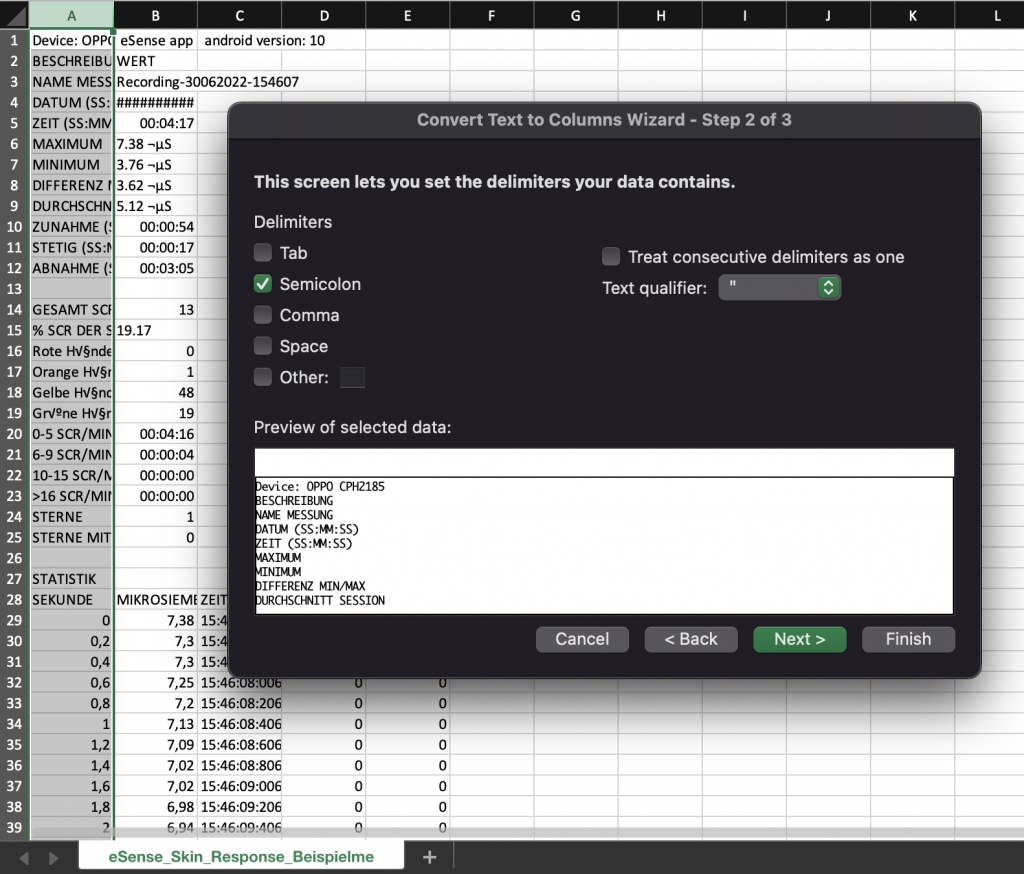
 2. Split values into columns (only necessary if you have different language settings in Excel™ and the eSense app) The values for time and measured value are still in the first column, separated by commas or semicolons. You must divide them into two columns.
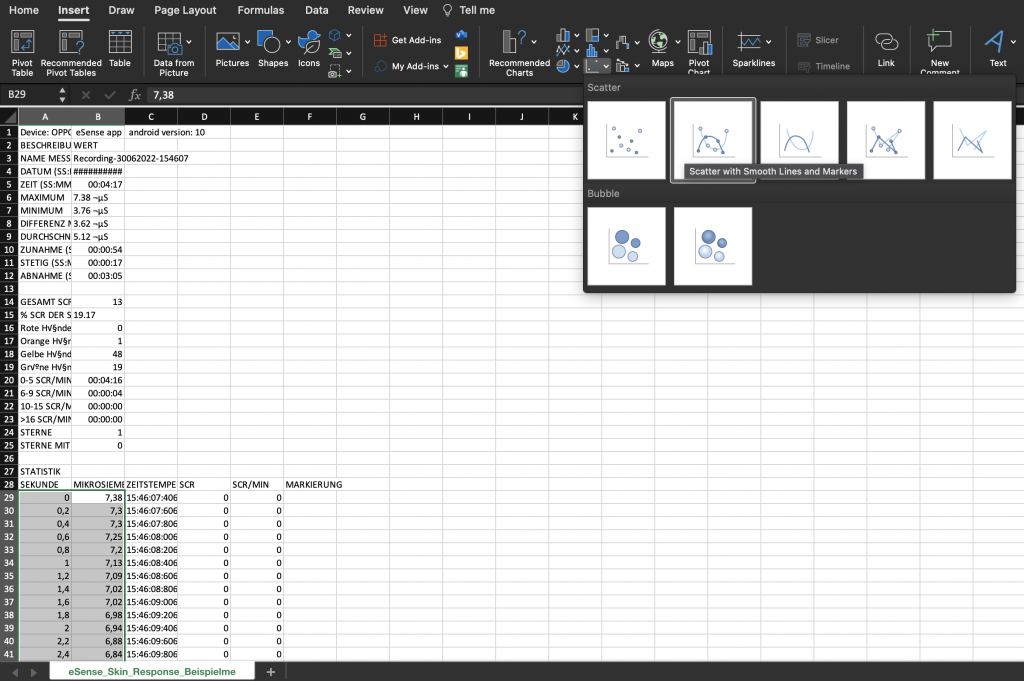
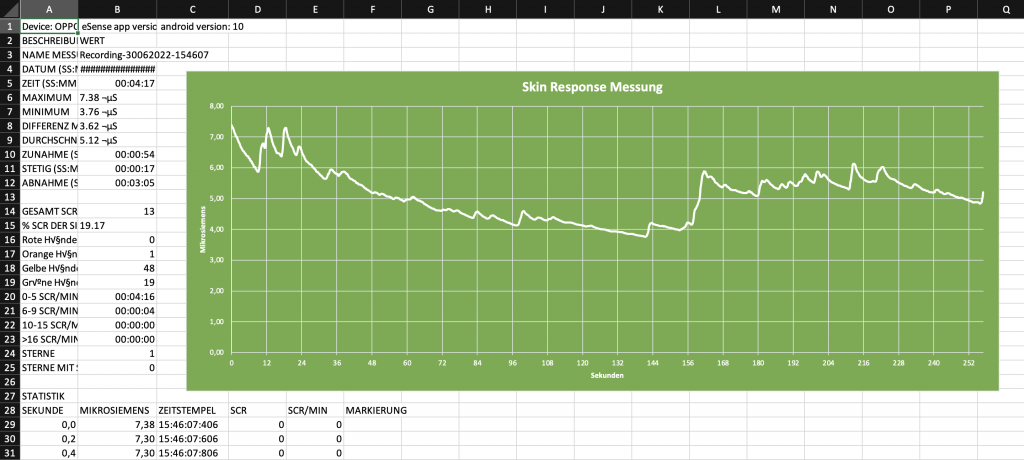
 3. Format seconds correctly (optional) Excel often formats the seconds in the first column automatically to a date. Unfortunately there is no way to disable this, it is preset by Excel. But there are a few ways to solve this: https://support.microsoft.com/en-us/office/stop-automatically-changing-numbers-to-dates-452bd2db-cc96-47d1-81e4-72cec11c4ed8 4. Draw skin conductance against time
   5. Draw skin conductance against markers
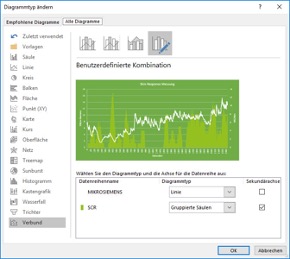
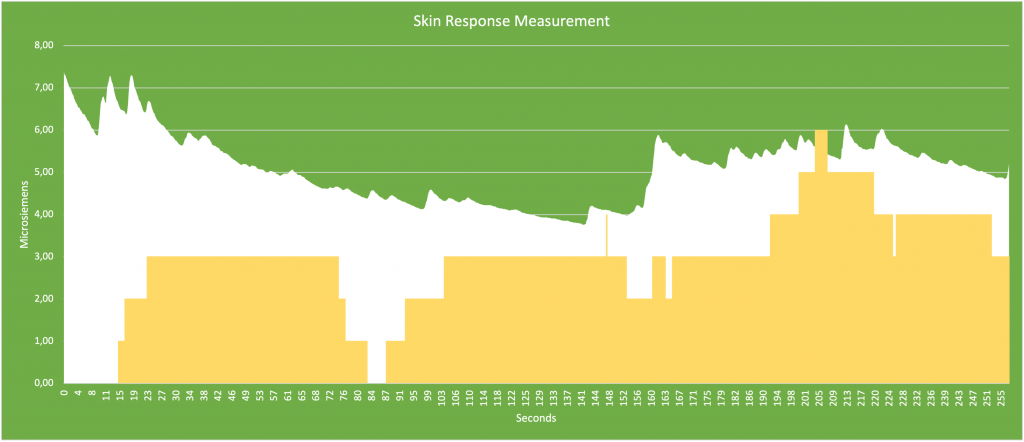
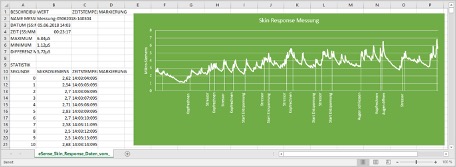 6. Draw skin conductance against SCR
  Google Drive (Google Sheets™, recommended)As in Excel™, complications with the separators can also occur here. The exported files are always CSV files. CSV stands for “Comma separated values. This means that a comma separates the values in the file (,) Google often tries to format the data automatically. Then it can happen, among other things, that the measured values are interpreted as date. To prevent this, you should first make sure that you select “Format” -> “Number” -> “Number”. 1. Replace decimal separator (only necessary if you have different language settings in Google Sheets™ and the eSense app)
 2. Split values into columns (only necessary if you have different language settings in Google Sheets™ and the eSense app) Depending on their language settings, the values for time and measured value are both in the first column, separated by commas or semicolons. You must divide them into two columns.
3. Apply skin conductance against time.
4. Enter main conductance against highlights
 The diagrams made via Google Sheets can also be embedded via iFrame. 7. Streaming eSense data to a PC/Mac/Browser (eSense Web App, OSC, LSL)We offer advanced users such as biofeedback trainers, therapists and coaches the ability to stream the measurement data of the eSense sensors via the eSense app to a PC as well. Thus, group courses can be realized or remote training, whereby the trainee can be in a very different place than the trainer. Even a remote supervision is easy. Unlock via In-App PurchaseThe OSC and LSL data transfer are paid add-on features of the eSense App and are unlocked via an in-app purchase directly inside the app. You will find the purchase under the “In-App Purchases” tab in the eSense App settings. Once unlocked, the OSC and LSL settings appear automatically in the app. Already included with the professional eSense Set: Customers of a professional eSense set (https://mindfield-shop.com/produkt/esense-set-exkl-sdk) receive the unlock as part of the set — for these users no additional in-app purchase is required. 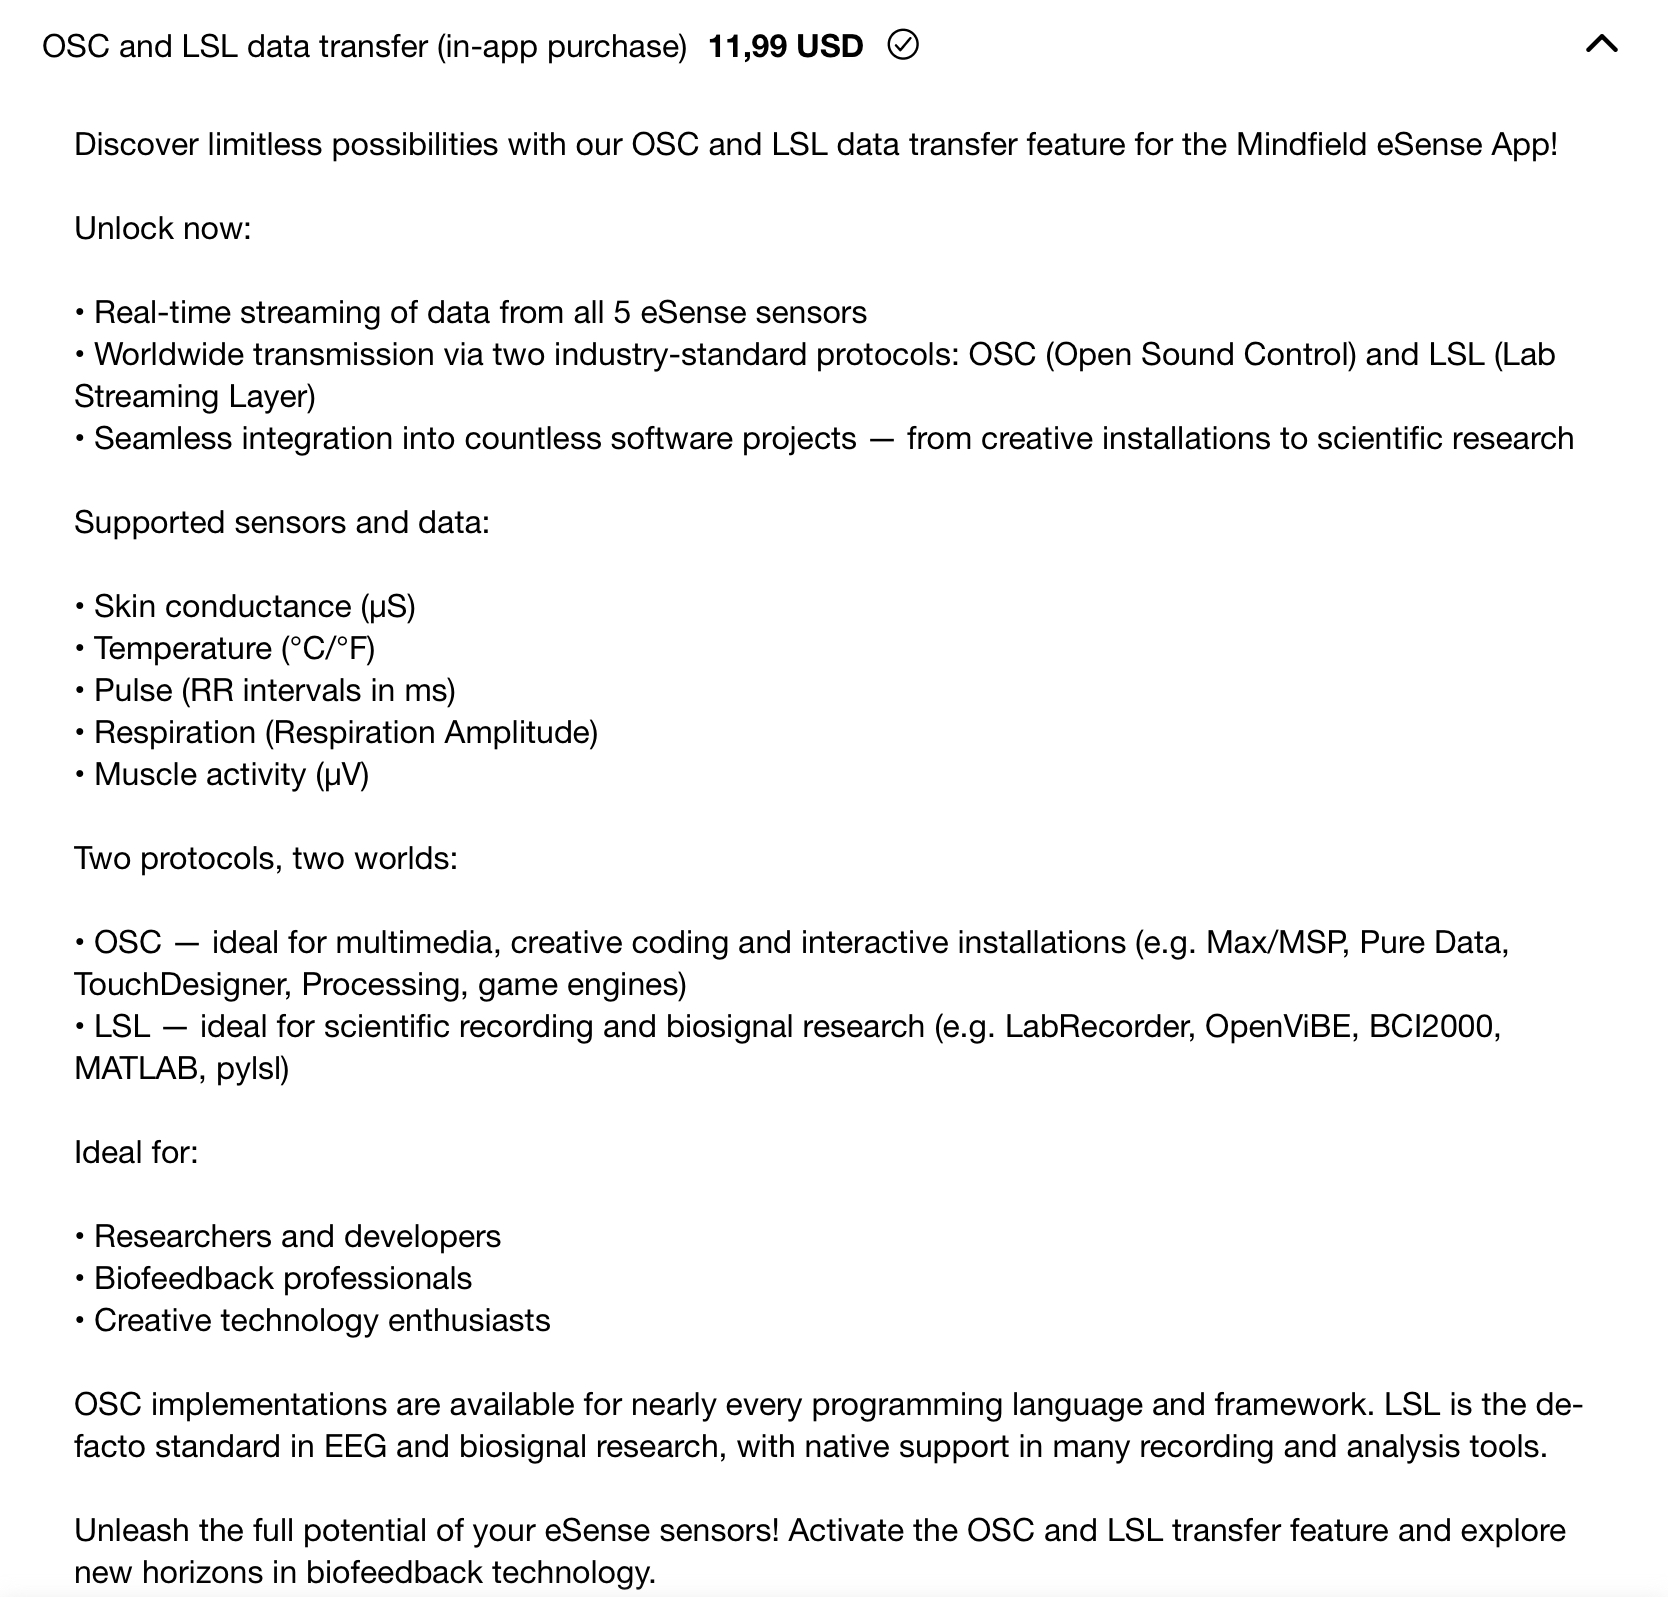 Note on the price: The price displayed (in the screenshot 11.99 USD as an example) is variable and may differ depending on your region, currency and the current Apple/Google App Store pricing tier. The applicable price for you is shown inside your eSense App in your local currency. The purchase is processed via your Apple or Google account; once unlocked, the feature is permanently tied to your account. Starting with version 8.x of the eSense App, we offer you three ways to transfer data from the eSense App to a PC, Mac or browser: our eSense Web App, the OSC transfer (Open Sound Control), and the LSL transfer (Lab Streaming Layer). All three can even be used in parallel; usually, however, it makes sense to pick the one that best fits your target application.
eSense Web AppWith the eSense Web App for iOS and Android, we have also developed an eSense web app for the browser, which mirrors and supplements the eSense mobile app. You need an account for the eSense app and one of our plans. You can analyze your recorded data in the browser (with the basic plan) or even stream it in real time to a PC (with the premium plan). With the eSense Web App you can view the measurements of several and different eSenses simultaneously and in real time. For example as professional user you can watch and look after a group of 5 different users, each with their own eSense. Different sensors, for example an eSense Skin Response with an eSense Pulse or Temperature or Respiration, can be freely combined. The users can even be distributed around the world. They just need a smartphone, an eSense sensor, the mobile app and a booked plan. More information about the plans soon here. 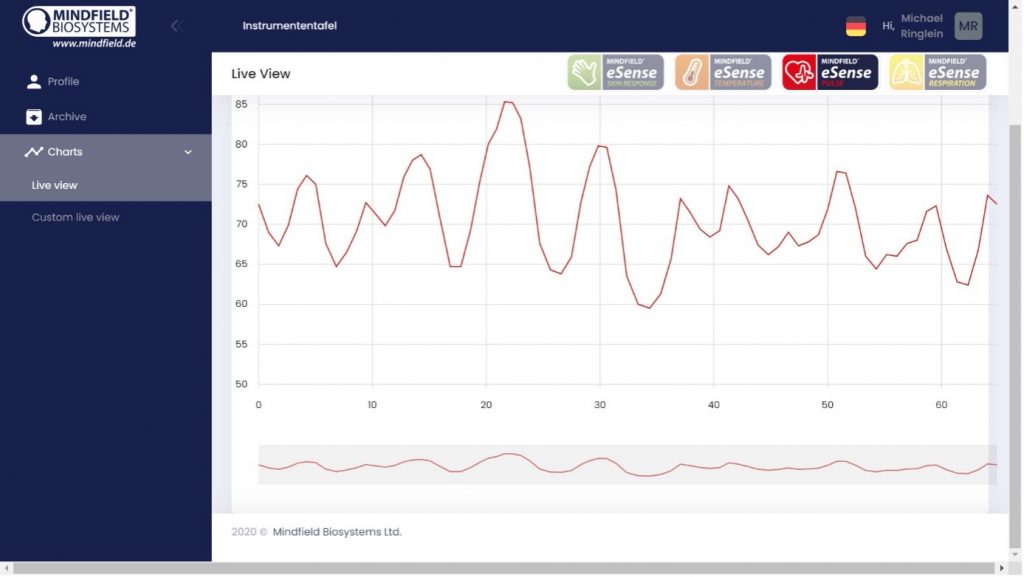 As a private user, you can also benefit from the fact that you can see the graph even better with a large screen and enlarge individual areas. You will find the eSense Web App at https://esense.live. There you can log in with the same account (username and password) as for the eSense mobile app. OSC and LSL – Real-Time Streaming Protocols for Biosignal DataFrom version 8.x onwards, the eSense App settings contain a combined “OSC and LSL” section. Both protocols allow you to forward the live measurement data of your eSense sensors to external applications in real time – they can be activated independently or used in combination. 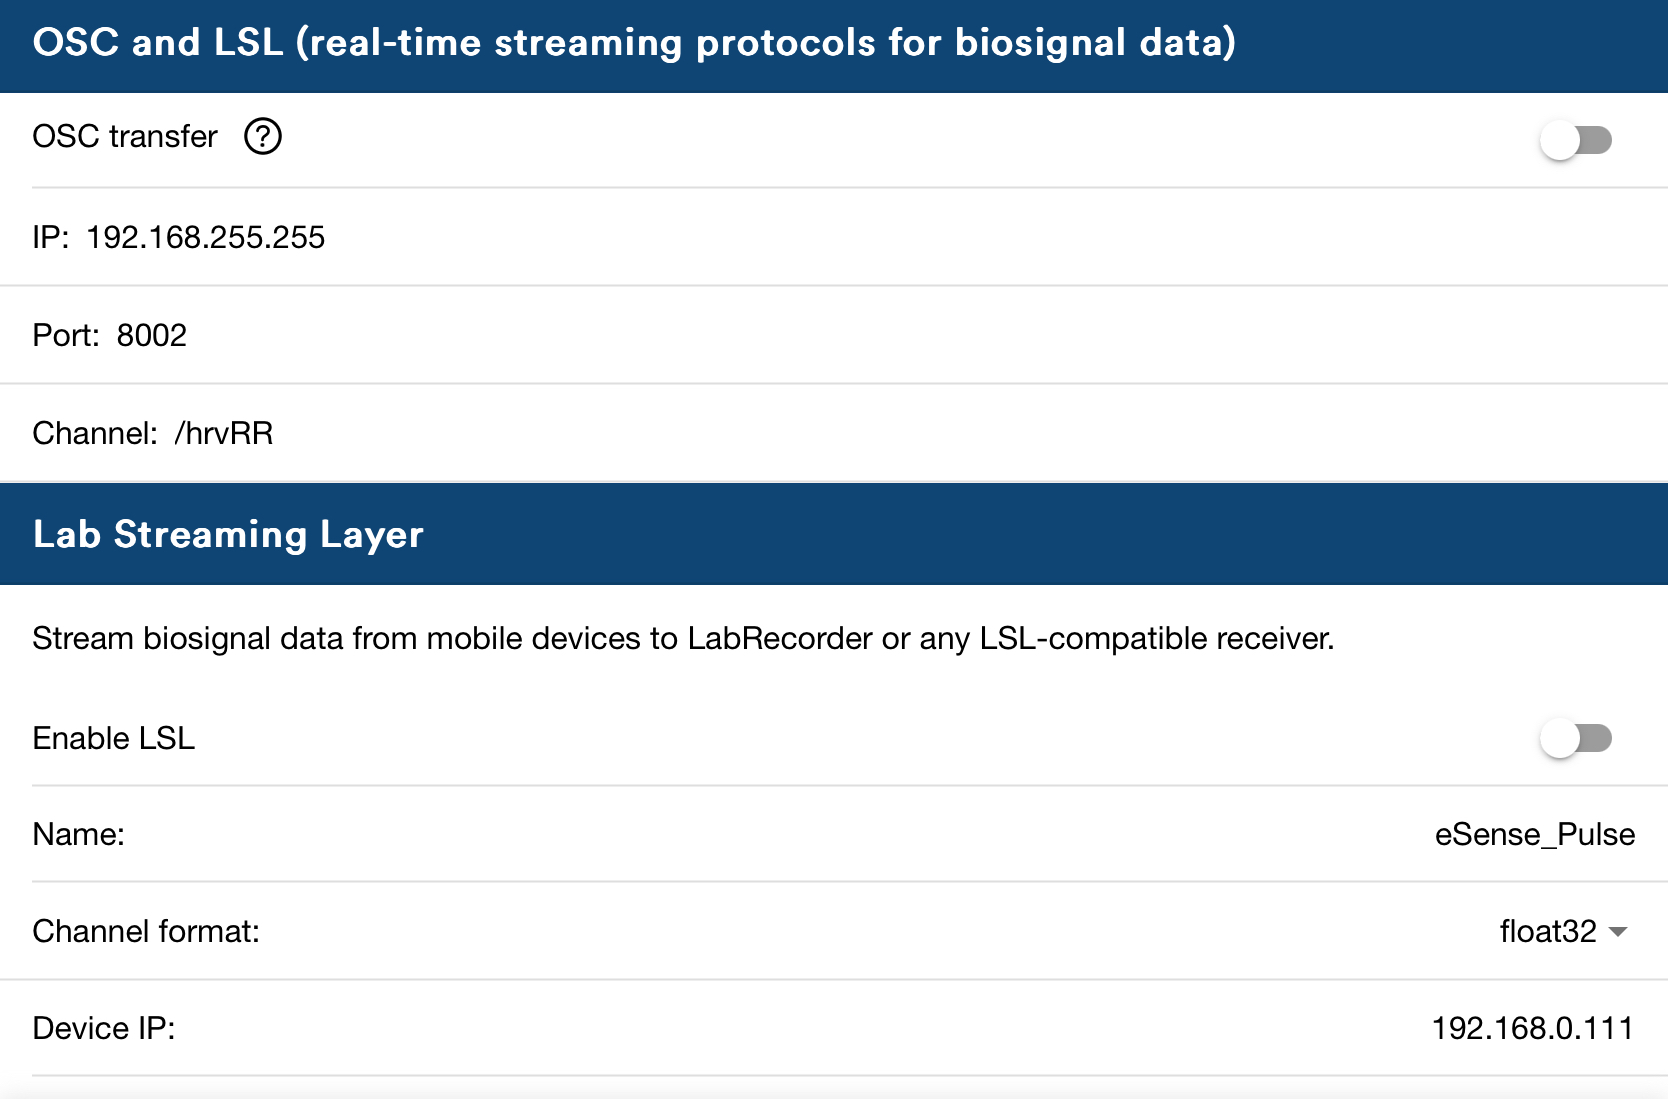 OSC Transfer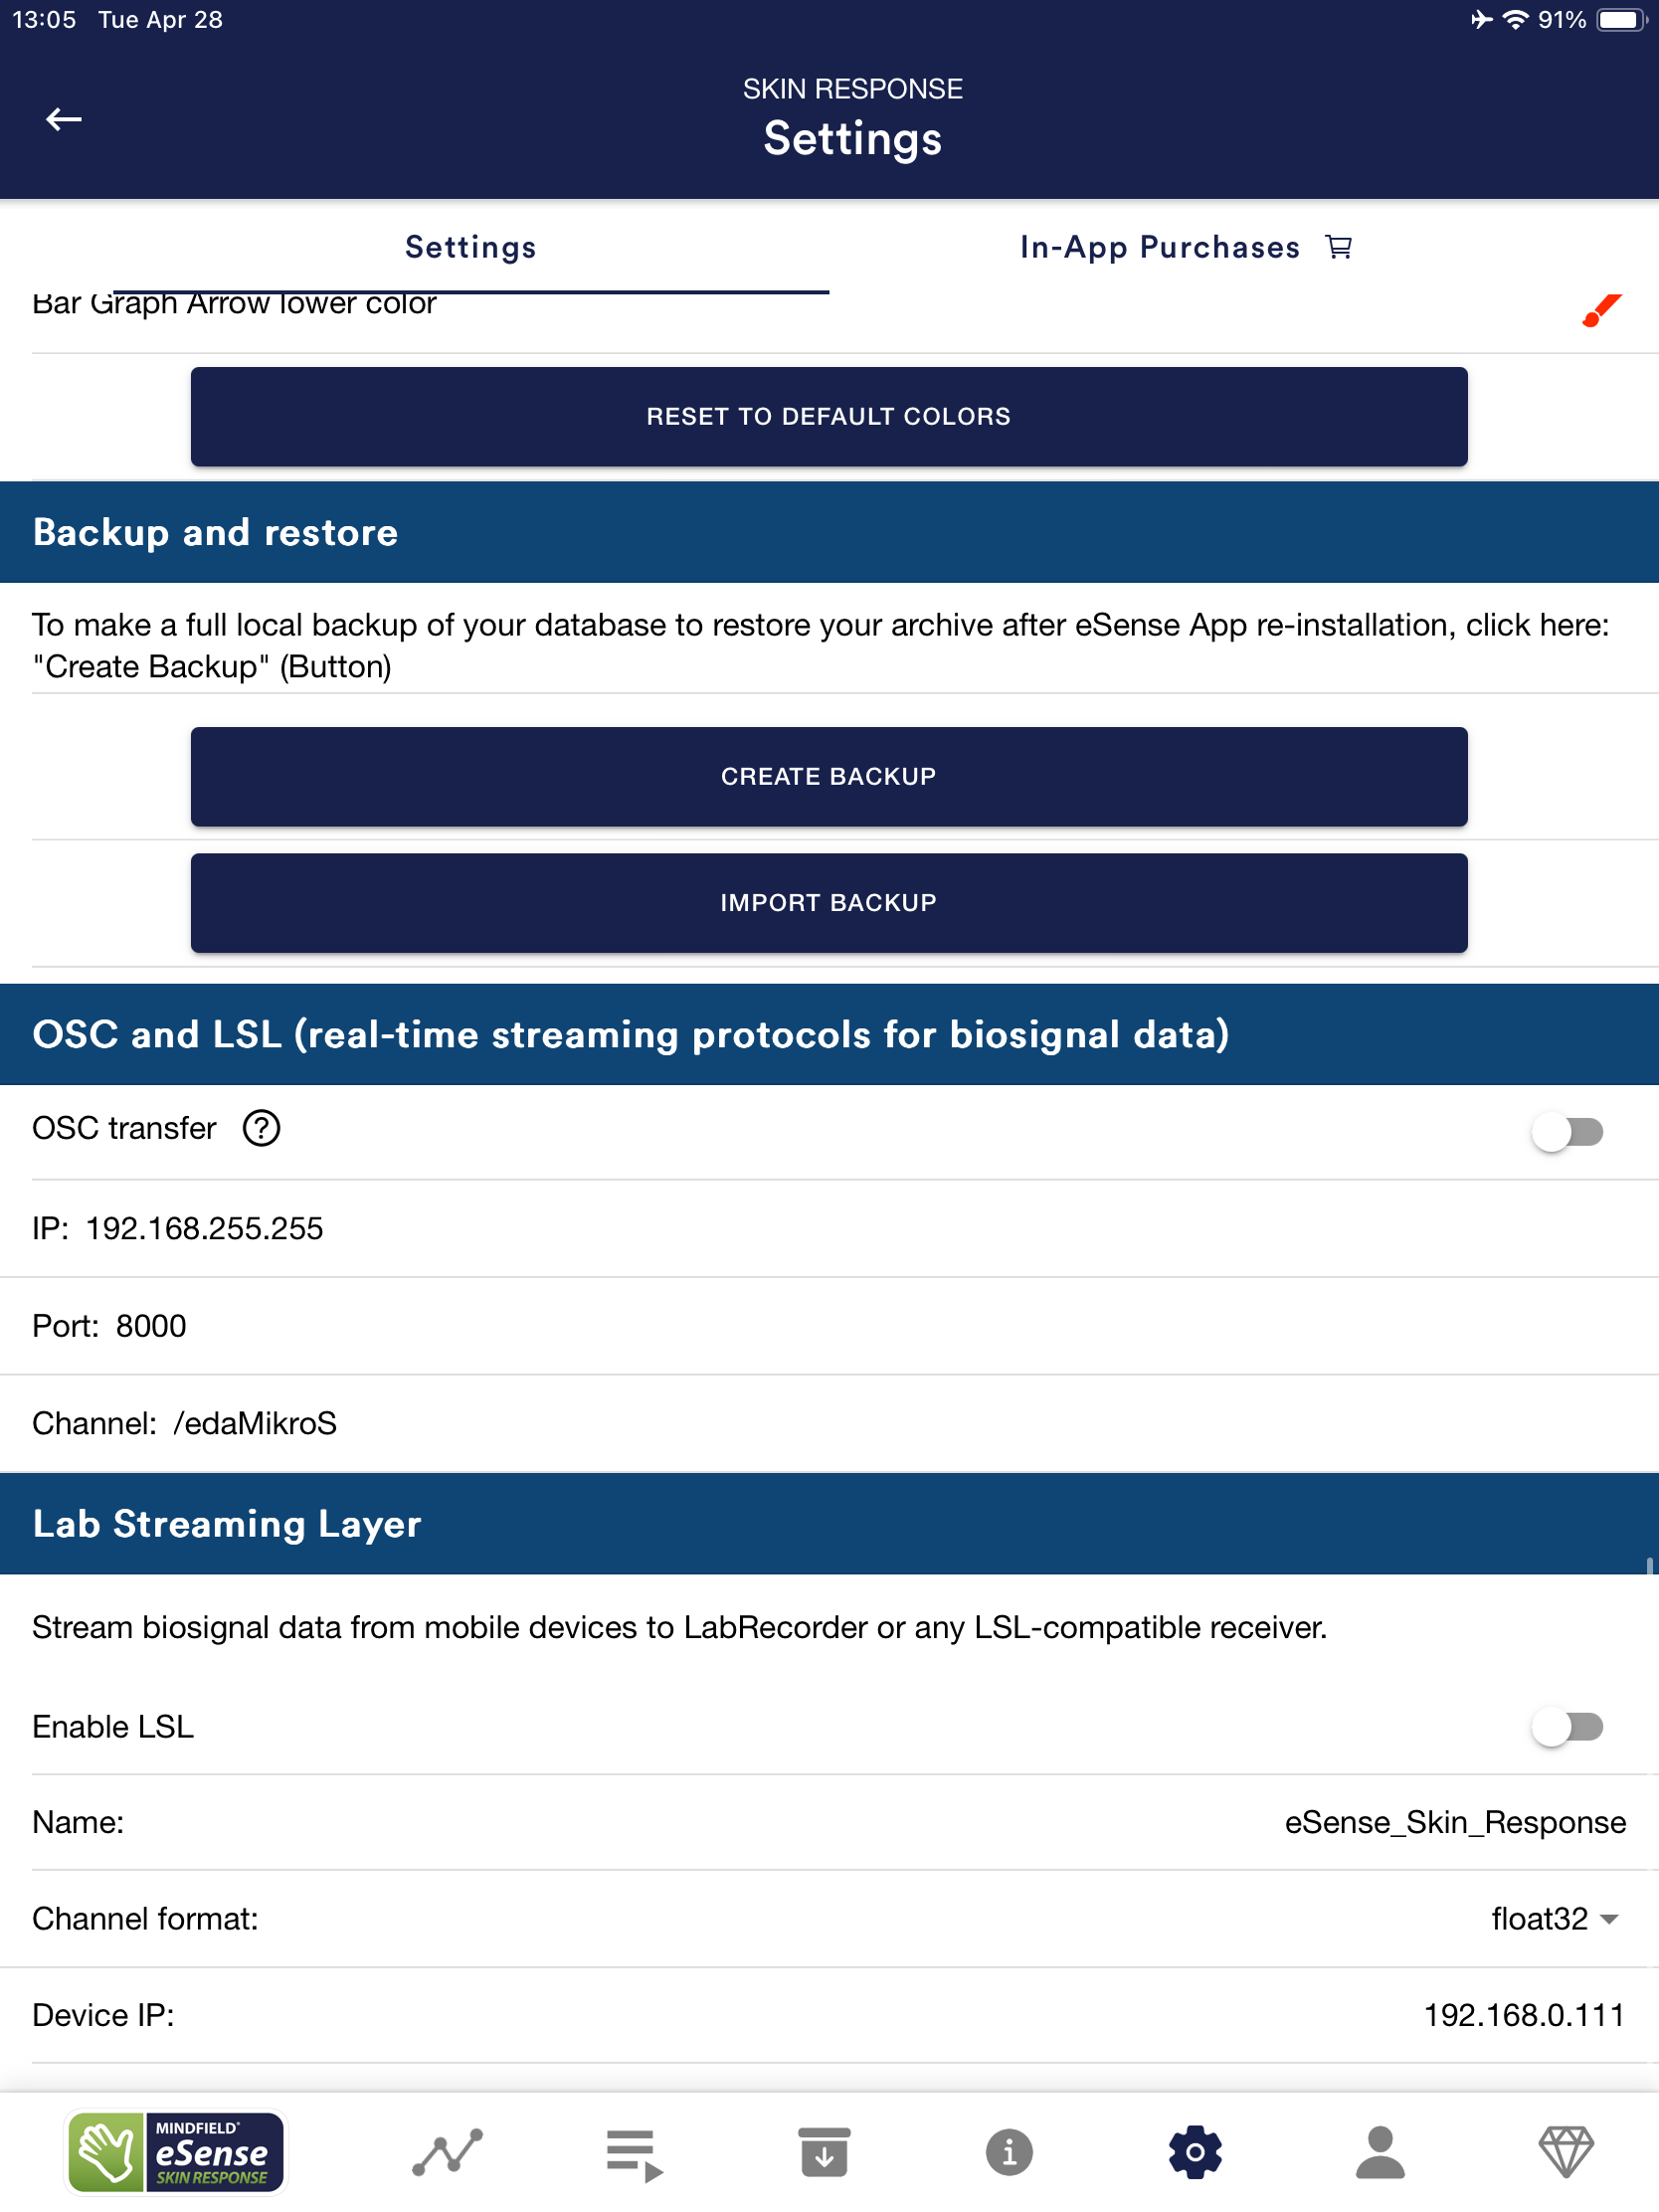 OSC (https://opensoundcontrol.stanford.edu) stands for “Open Sound Control” and is an open-source network protocol developed by the University of California at Berkeley. It is widely used in the music industry because it is great for processing different signals in real time (for example, at a concert where multiple microphones and lights have to be matched in real time). This makes the protocol particularly well suited for the real-time data transmission of several eSenses. Due to its wide adoption in the music industry, there are already several extensions and plugins which you can adapt relatively easily and use in your own software. These are usually available in all common programming languages like Android, iOS, Java, JavaScript, C++, Python and many more. Typical target applications are Max/MSP, Pure Data, TouchDesigner, Processing and game engines. To use OSC with the eSense app, you must define the IP address of the receiver. This can be a local IP address or an IP address on the internet. You can define the ports as you wish. You should pay attention to firewalls, as they may block the flow of data. In the app you can also define a variable to be able to assign different eSense devices. This allows you to sort, filter and analyze the eSense (or its users) more easily. The OSC transfer is aimed at programmers of (Windows or Mac) software who want to integrate the data from the eSense. The available OSC libraries in the usual programming languages make such an integration very easy. LSL Transfer (Lab Streaming Layer)LSL stands for “Lab Streaming Layer” and is an open-source system for the real-time acquisition, streaming and synchronization of biosignal data. It was developed at the University of California, San Diego (Swartz Center for Computational Neuroscience) and has become the de-facto standard in EEG and biosignal research. While OSC plays its strengths in creative and multimedia contexts, LSL is specifically aimed at research labs, universities and clinical studies, where multiple data sources (EEG, biosignals, markers, eye-tracking, video) need to be recorded with precise time synchronization. With the LSL transfer of the eSense App, you can feed the live data of your eSense sensors into any LSL-compatible receiver, including:
In the LSL settings of the eSense App, you define a stream name (e.g. eSense_Pulse or eSense_Skin_Response), the channel format (default float32), and the device IP address. The stream is then published on the network and can be discovered and recorded by any LSL receiver. LSL is the ideal choice if you want to collect peer-reviewed research data, synchronize multiple biosignal sources with precise timing, or integrate the eSense sensors into an existing research environment such as LabRecorder or OpenViBE. Further information and documentation on LSLThe Lab Streaming Layer project is maintained by the research community at the Swartz Center for Computational Neuroscience (UCSD). A comprehensive introduction, technical specifications and code examples are available on the official project pages:
You can enable both the OSC and LSL transfer in the general settings of the eSense app (see screenshot above). Apple Health and Health ConnectWould you like to transfer eSense values to your smartphone’s health apps instead? You can find an overview of the export to Apple Health (iOS) and Health Connect by Android under Apple Health and Health Connect. 8. Duplicate eSense on a large screen (screen mirroring)With the eSense app, it is possible to display the screen content of a tablet or smartphone on a larger screen, which is known as stream mirroring. This allows you to watch your biofeedback training at home on your big screen TV, for example, which can improve your training. The following instructions can be used with all eSense devices. An adapter is always required: Smartphone / tablet (with the eSense app) We generally recommend iOS devices. AndroidWith Android, it only works with newer devices that have a USB-C output and a 3.5 mm jack plug. Android devices with micro USB do not work.  Our recommendation is this adapter on Amazon: JSAUX USB C HDMI Adapter, 4K USB Type-C Thunderbolt 3 auf HDMI Adapter https://amzn.to/3Use9HpeSense Skin Response, Temperature and Respiration: If your device no longer has a 3.5mm jack plug and you are already using a USB-C to 3.5mm jack adapter for the eSense, unfortunately you cannot use the USB-C to HDMI adapter. Wireless with HDMI dongles (Miracast / Chromecast etc.)We have had rather mixed experiences with the common HDMI dongles. There are many options, but the dongles generally require an external power supply and are rather complicated to set up. We therefore advise against using them, but in principle it works and is an alternative if no further adapter is available in the device (because the device only has a USB-C but no longer has a 3.5mm jack plug). iOSYou can connect a Lightning Digital AV Adapter or a USB-C Digital AV Multiport Adapter to the Lightning port of your iOS device and use an HDMI cable (sold separately) to connect your iOS device to a TV or projector. In principle, this is possible with any iPhone, iPad and iPad Pro that are also compatible with our eSense app. We expressly recommend only original Apple adapters. Others may work under certain circumstances if they have MFI certification. However, Apple could change something at any time, so we do not recommend third-party adapters, which may not be updated quickly enough and may no longer be compatible. You can find the original Apple adapters on Amazon:  Apple Lightning Digital AV Adapter https://amzn.to/3y7ndtY
 Apple USB-C-Digital-AV-Multiport-Adapter https://amzn.to/3wdvoEx
eSense Skin Response, Temperature and Respiration: iOS also requires a USB-C to 3.5mm jack adapter for these eSense devices (this is not required for the eSense Pulse and Muscle as they connect to the smartphone or tablet via Bluetooth). This means that if you want to use an iPad with the eSense, it should also have a 3.5mm jack connection. The iPad Mini 5 would be an example, this is slightly older, but still has the 3.5mm jack connection. For normal iPads, the 9th generation devices were the last with the 3.5mm jack connection. We recommend https://www.refurbed.de/c/ipads/ or https://www.rebuy.de/kaufen/apple-tablets to purchase these at a reasonable price. Wireless with AirplayWe have had good experiences with AirPlay. The setup at Apple is very simple, the best solution is probably a used Apple TV from 50 euros: Apple TV 4K Gen 1 https://www.refurbed.de/p/apple-tv-4k-5th-gen/ Mini projectorThere are now also relatively good mini projectors available for an acceptable price. In our experience, these are not particularly bright, but in a sufficiently dark room they are an option. The projector only needs an HDMI input. 9. Troubleshooting connection problems
10. EC Declaration of Conformityin accordance with the following directive(s): Radio Equipment Directive (2014/53/EU) The manufacturer Mindfield Biosystems Ltd. hereby declares that the following product: “Mindfield® eSense Pulse” complies with all applicable essential requirements of the directives. It is in conformity with the applicable requirements of the following documents: DIN EN 60950-1 Information technology equipment – Safety – Part 1: General requirements (2013) DIN EN 62479 Assessment of the compliance of low power electronic and electrical equipment with the basic restrictions related to human exposure to electromagnetic fields (10 MHz to 300 GHz) (IEC 62479:2010, modified) ETSI EN 300 328 V2.1.1 (2016-11) ETSI EN 300 440 V2.1.1 (2017-03) Place: Gronau  WEEE-Reg.-Nr. DE 24465971 11. ContactMindfield® Biosystems Ltd. · Hindenburgring 4 · D-48599 Gronau Tel: + 49 (0)2565 406 27 27 · Fax: + 49 (0)2565 406 27 28 · E-Mail: info@mindfield.de If you have questions about our products or need support, please do not hesitate to contact us! To avoid inappropriate advertising and spam, we ignore messages with specific content. We therefore ask you to not write links in the contact form. If this should be necessary, please write us an email. Please do not send unsolicited packages to us. Unfree returns will not be accepted and cannot be processed. 12. General information on heartbeat and heart rate variabilityOur hearts keep us alive and work tirelessly throughout our lives. It pumps the blood through our body, so that oxygen-rich blood penetrates all the parts of our body and oxygen-poor blood is enriched again in the lungs with fresh oxygen. But it also keeps everything moving, including the transport of nutrients, hormones, immune cells, etc. It is easy to know that our heart is beating, you can feel your pulse or even hear it when you put one ear to the chest of another person. Since time immemorial, we have been studying and measuring the functions of the heart and measuring the heartbeat is essential. Depending on the situation, our heart is able to regulate the heartbeat. When we sleep, it usually beats slowly and evenly, when we exercise, it beats fast and adjusts its frequency constantly. Depending on the creature, the resting pulse changes: only six heartbeats per minute for a blue whale and 1,000 heartbeats per minute for a shrew. We humans lie with approximately 60 heartbeats per minute in the lower range, infants have a faster resting pulse of approximately 130 beats per minute. With great effort, our heart can also beat at over 200 beats per minute. Heart rate variability (HRV) refers to the ability to change the frequency of the heart rhythm. Even at rest, there are spontaneous changes in the time between heartbeats. Our body has a multitude of regulatory mechanisms to change the heart rhythm. Two essential components are the sympathetic nervous system, which activates and accelerates the heartbeat, and the parasympathetic nervous system, which acts as a brake to slow down the heartbeat. A healthy person constantly adapts the heart rhythm to current requirements. In addition to physical exertion, such as sport or physical work, psychological exertion such as stress also results in an increase in the heart rate. The heart rate sinks again when the strain is relieved and the body relaxes. In humans, heart rate variability ranges from 10 (low, a sign of stress) to 30 (high, a sign of relaxation). The more our body is able to regulate the heart rate (the greater the heart rate variability), the healthier we are. If the heart beats only rigidly, a person is about to die. The measurement of heart rate variability is a large field in cardiology and is used for extensive diagnostics. With the eSense Pulse, we want to focus on biofeedback training, i.e.improving heart rate variability. To describe the current state and progress of the training, the eSense app also provides the essential statistics and analyses of HRV. We combine the measurement and feedback of heart rate variability in the eSense app with guided relaxation exercises and guided meditations and offer you an overall experience that goes beyond biofeedback. In addition to extensive feedback variants, you have the option of evaluating your measurements with many statistics, documenting your progress and exporting the recordings as CSV and PDF files. Your data belongs only to you! You have full access to the raw data. 13. Features of the eSense PulseThe eSense Pulse is a pulse sensor that uses a smartphone/tablet and an app to accurately measure heart rate variability. We focus not only on measurement, but also on biofeedback training to improve your heart rate variability and health! The eSense Pulse with the eSense App offers you:
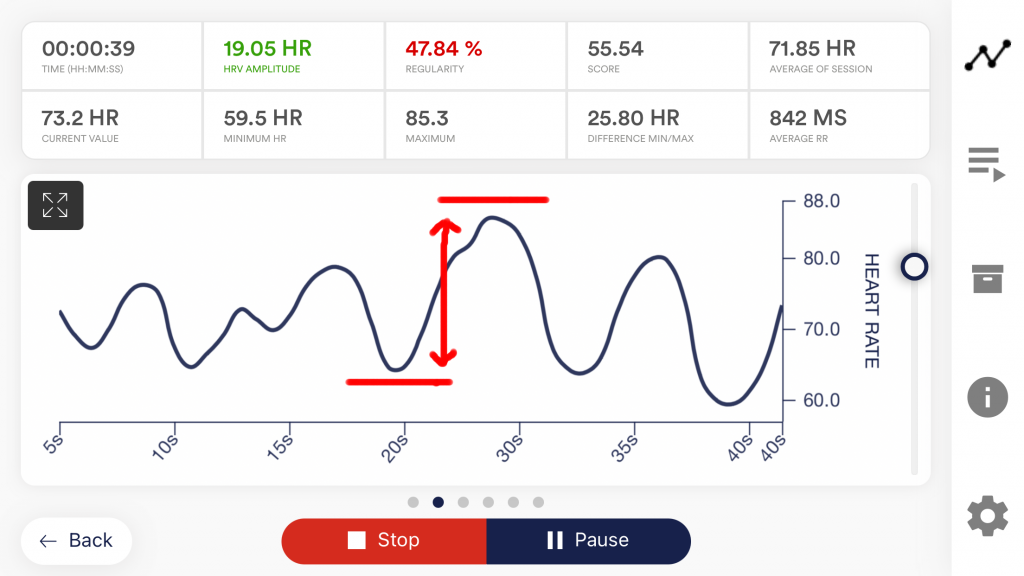
14. Explanation of the individual measured valuesScore (developed specifically by Mindfield) For the Mindfield app, we have developed our own score system. This score, developed by us, should simply tell you how good your heart rate variability is with just one number. Simply put, the better your heart rate variability, the higher this value. In detail: The score is the sum of the regularity of the curve (in percent) and the amplitude (absolute value) divided by the rate of data from eSense Pulse (which transmits the last measured values via Bluetooth® every 200 ms) plus the previous score.  Whereby the time interval between Score and Score0 is just 200ms. If Regularity Percent << 90 then:  Thus, especially measurements of the same duration can be compared well (for example, if you always set 15 minutes as the measurement duration in the settings), since a higher regularity of the curve and / or a higher amplitude but constant time results in a higher value. Regularity (developed specifically by Mindfield) We also included the regularity as another value. This is also recorded by a formula developed by us and displayed in color (from a measurement duration of 5 minutes or more) in the overview after the measurement: 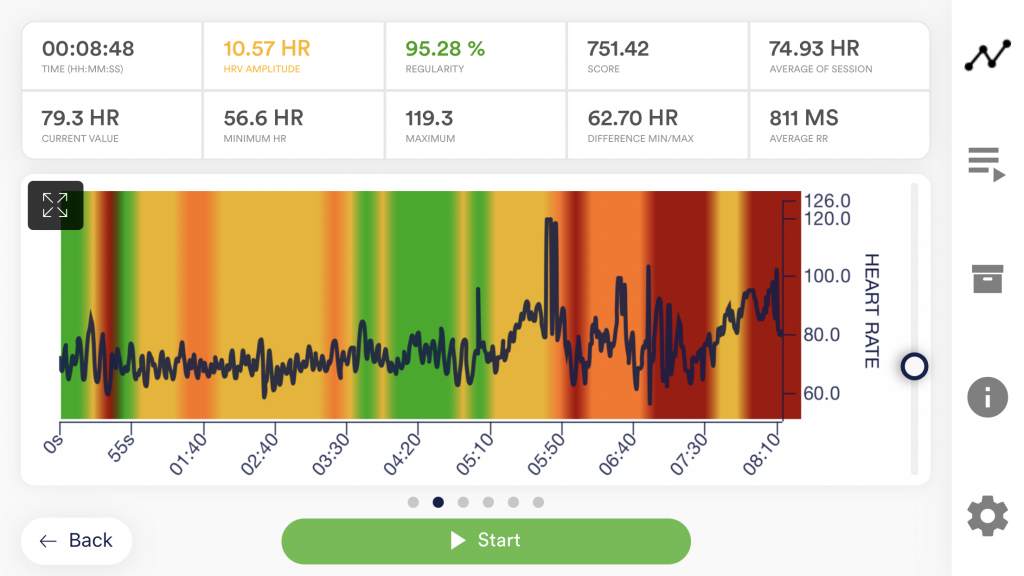 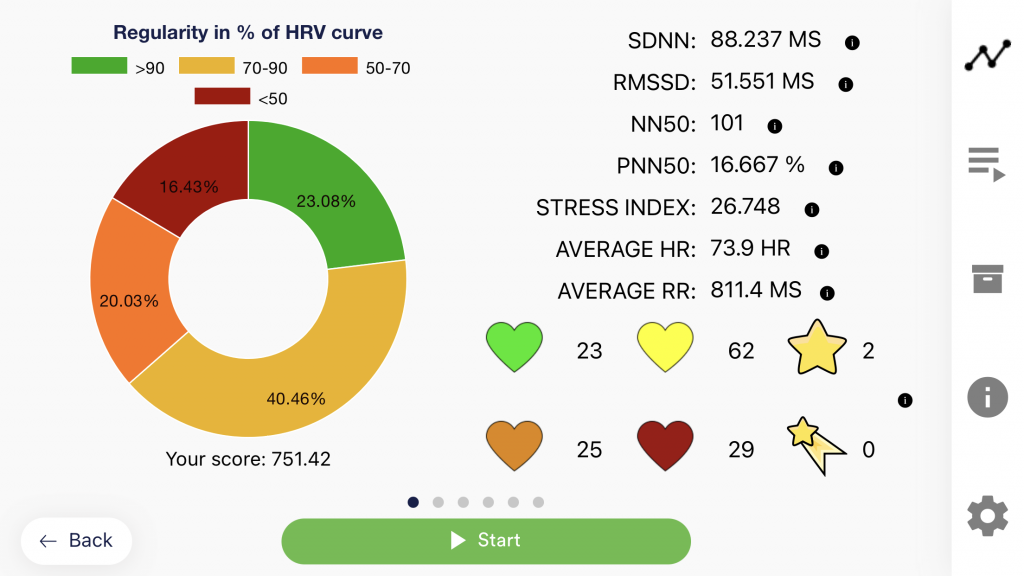 Attention: The colored coloring of the regularity does not correspond 100% with the color distribution in the pie chart as these are detected in different ways. For the background coloring of the oscilloscope, a period of 20 seconds is taken and it is determined which regularity value is the most common color. The pie chart, on the other hand, uses all the numeric regularity values of the entire session, with the percentages in red, yellow, orange, and green taken from them. General HRV values As an introduction to all measured values, we would like to briefly point out that the terms RR and NN mean the same thing but are used alternately in science and literature. The RR or NN interval is the distance between two heartbeats, in milliseconds.  Put simply, you train as much variability as possible between these intervals. The analysis of this distance data is possible in different parameters, which allow for different conclusions about the condition of your nervous system. Time-based measured values SDNN RMSDD NN50 pNN50 Average RR To get a feeling for this value, just think of the following three examples: If you have a resting pulse of 60 beats per minute, the average RR is exactly 1,000ms or one second (since one beat per second). If you are doing light to medium physical exertion at 120 beats per minute, then the RR is 500ms, or half a second (since two beats per second). If you’re working very hard to get your pulse up to 180 beats per second, the RR is 333ms or a third of a second (because three beats per second). For this value, there is no better or worse, the bigger or smaller. The only statement that can be made is that the higher the value at rest, the slower your resting pulse, which, for example, is a sign of fitness and a strong heart muscle in endurance athletes. Stress Index Frequency-based measured values (available as in-app-purchase) In addition to the time parameters, we have also integrated frequency-based parameters into the analysis. A Fast Fourier Transformation is performed during each measurement from start to finish. You can observe the resulting spectrogram during the measurement in the last slide in landscape format. VLF LF HF LF / HF ratio 15. Introduction to eSense PulseThere are various methods for measuring the heartbeat. With the eSense Pulse, we have decided on a chest strap that performs a 1-channel ECG measurement. There are two electrodes in the chest strap which require good, direct skin contact. The chest strap must always be worn under clothing. 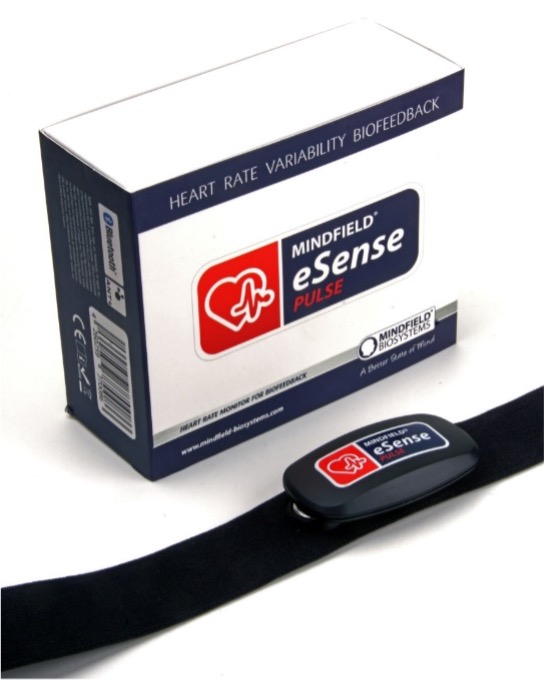 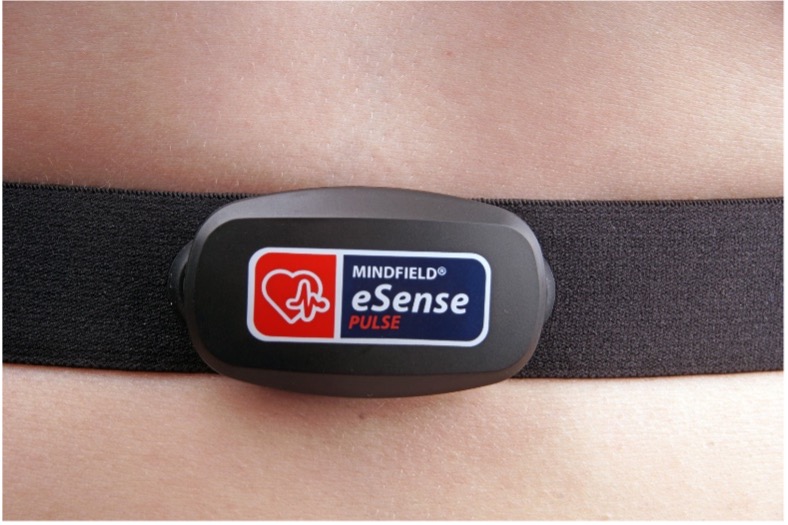 In order to ensure a good contact between the electrodes and the skin, the enclosed electrode contact spray or an equivalent electrode gel should be used. Without it, the heartbeat sensors will not take sufficient measurements, which makes a precise HRV measurement difficult. For more information, see the article about the open training. The eSense Pulse uses a 500 Hz sampling rate (500 times per second) to determine heart beats and wirelessly transmits the time between two heart beats to your smartphone/tablet and the eSense App in milliseconds via Bluetooth®. Compared to the normal electrocardiogram (ECG), in which the waveform is very important, the measurement of heart rate variability focuses on the temporal resolution of the RR intervals. With this data, the eSense App can then perform various calculations, such as determining the heart rate (beats per minute or, colloquially, the pulse), the heart rate variability with various analysis parameters and biofeedback training. In the article explanation of the individual measured values, all parameters of the eSense App and their meaning are explained clearly. It also important to note that heart rate variability benefits respiration. Of particular interest is the coupling of heartbeat and respiration in order to determine the degree of coherence or synchronization of heart rhythm and respiratory rate. This is also done in the eSense App. The heart rate increases when inhaling and decreases again when exhaling This phenomenon is called respiratory sinus arrhythmia (RSA) and is used to check the balance of the nervous system. Biofeedback training in the eSense App uses this phenomenon to improve heart rate variability with the help of a breathing target. Regular biofeedback training with the eSense Pulse has a positive effect on heart rate variability and RSA, and both have a positive effect on a number of stress-related problems. Bring your nervous system back into balance! 16. Operating instructions for the eSense PulseContents of the packaging:
Remove the eSense from its packaging. Put on the chest strap as shown and adjust it to the correct length. 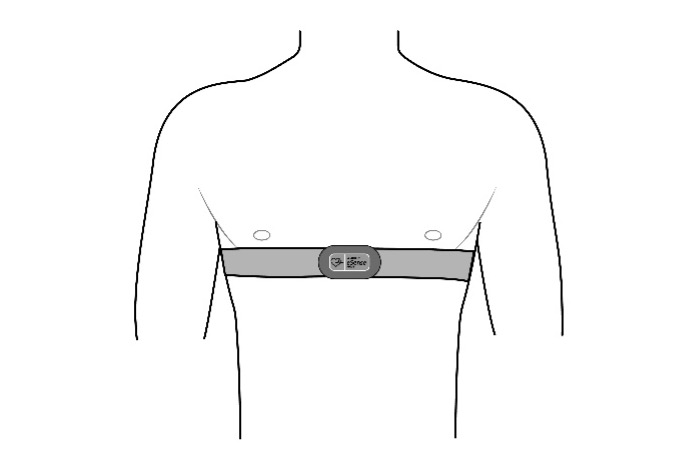 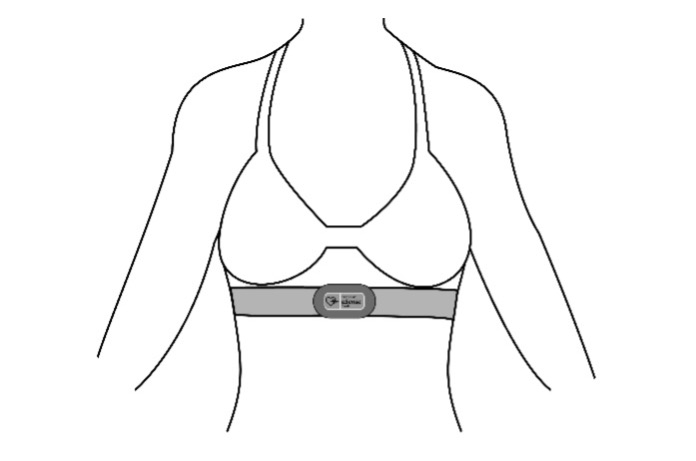 The strap should be tight, directly under the chest muscles, but not uncomfortably tight or squeezed. Once you have adjusted the belt, remove it again to apply a small spray of the enclosed electrode contact spray to each electrode. This surface separates the two electrodes from each other! No “bridging” may occur here. 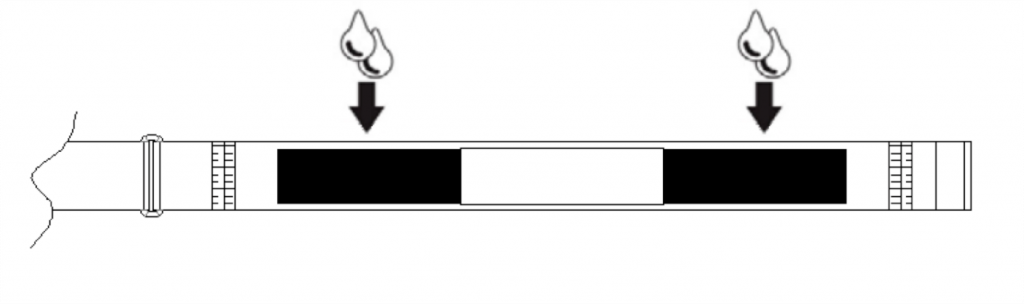 This process significantly improves the conductivity and the ECG signal becomes clean and precise. Put on the belt again and press the eSense Pulse Sensor on the two push buttons. Make sure that the eSense logo on the front is not upside down for a person looking at you. You will also find an “L” for left and an “R” for right on the push buttons on the sensor. 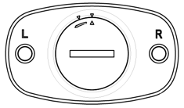 Now the eSense Pulse is ready to use and can be connected to the eSense App. In case of any connection problems, briefly remove the sensor and reconnect it to the belt. This will switch it on and off. To prevent the battery in the sensor from being used up unnecessarily, always disconnect it from the belt when not in use. Battery Change & Battery InformationThe battery has a service life of approx. one year if used regularly. You can read the current state of charge in the eSense App. A replacement battery type CR2032 is available in our online shop or in any electronics store. Dispose of a used battery professionally and not in the household waste. Batteries are very dangerous if swallowed. For this reason, keep batteries and small parts away from children. If a battery has been swallowed, consult a doctor immediately. 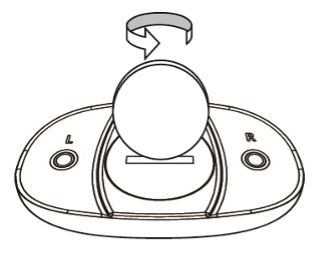 To change the battery, open the battery compartment by turning it counterclockwise with a coin. The battery is facing up with the positive pole. Insert the new battery and close the battery compartment again by pressing on the cover and turning it clockwise for a short time. Cleaning and CareImportant instructions for cleaning and care:
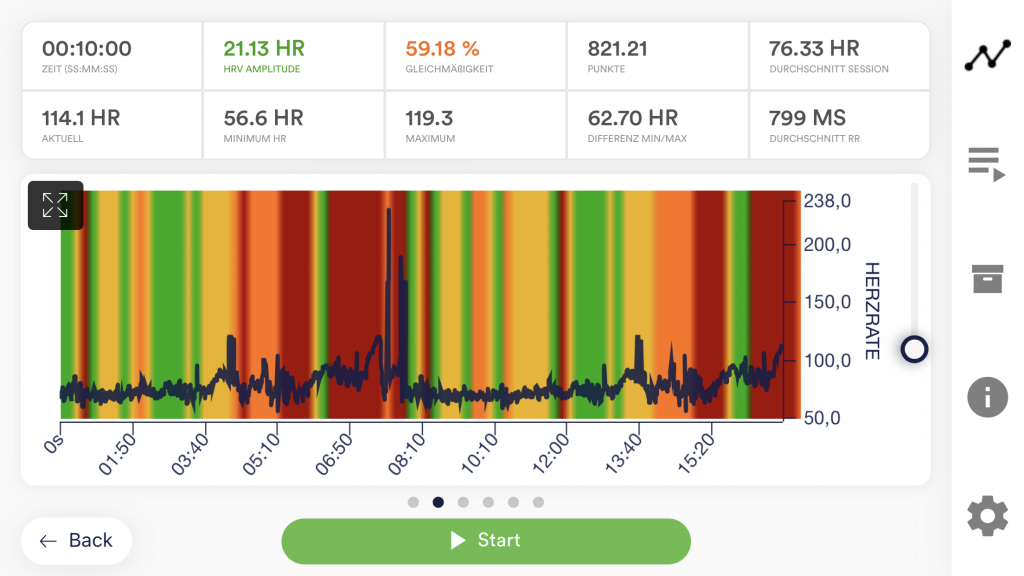
17. Heart Rate Variability and Biofeedback TrainingIn order to reduce stress and its symptoms, biofeedback training can be performed seeking to increase heart rate variability. Biofeedback training is quite applicable to heart rate variability In stress medicine and psychophysiology, HRV biofeedback is used for depression, heart disease, asthma, anxiety disorders and insomnia. HRV biofeedback is also widely used in coaching and competitive sports. Improving HRV and the connection between breathing and the heart can help relieve tension, cope with stress and anxiety, and contribute to a more relaxed response in everyday life. If you suffer from a serious disorder or medical condition, always consult a professional physician or therapist, and do not attempt to treat yourself. The eSense Pulse is not a medical device and may only be used to reduce stress. The eSense Pulse is a very precise device. It can record heartbeats and display them, for example, as a measurement curve. Take a look at the following example of a measurement at rest and with even, slow breathing: 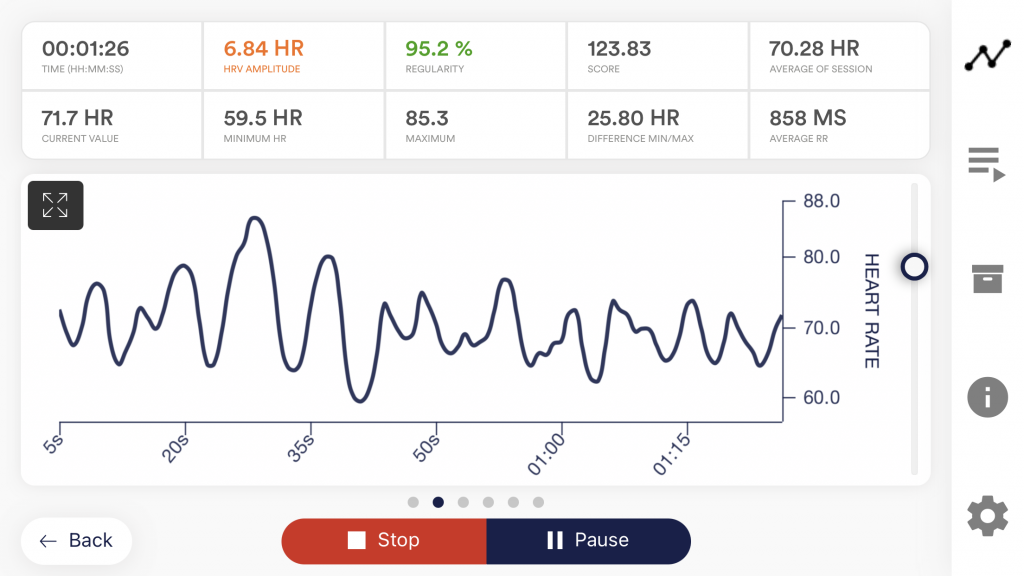 and pronounced heart rate variability. As you can see in the example above, the curve is a distinct sine wave and the amplitudes are very uniform. The aim of HRV biofeedback is to increase heart rate variability, specifically its amplitude. In other words, to maximize the difference between low heart rhythm and high heart rhythm in the interplay of inhalation and exhalation, rest and demands. Under demands and with uneven breathing, HRV and its curve shape decreases significantly, as shown in the figure below: 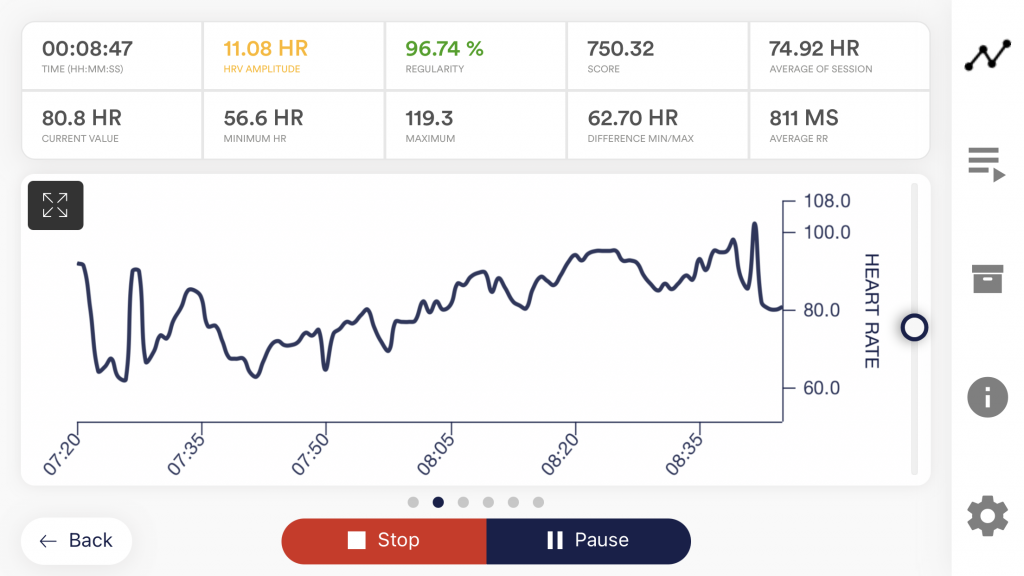 or demands and low heart rate variability. In the above example, the curve is uneven, and the deflections are different. Especially from 6:30 and 6:50 the line is almost horizontal with almost no amplitudes. If respiration is included, the eSense App offers various ways to visualize it and to define respiration in a certain rhythm. The coupling of heartbeat and respiration is greatest in most people when breathing at about 4.5 to 6.5 breaths per minute.[1] In the eSense app, you can do a free training or complete predefined procedures. The amplitude of HRV is measured and an increase is providing positive feedback, while a decrease provides negative feedback. A change in breathing is also linked to feedback. [1] Lehrer, P. M. (2013). How does heart rate variability biofeedback work? Resonance, the baroreflex, and other mechanisms. Biofeedback, 41, 26-31. For feedback, there is, for example, a video, that continues to run in the positive case (stops in the negative case), music, whose volume changes, tones, which change pitch, vibration of the Smartphone and much more. Of interest is the function for controlling a smart light bulb (Philips Hue or Magic Blue), whereby heart rate variability is reflected in the change in color and brightness of one or more lamps. You can use your stress level to illuminate an entire room. A biofeedback training consists of four training stages. Plan about 60 to 90 minutes for the first session, during which you can do the training undisturbed and in one session. Detailed instructions can be found in the chapter, “Training sequence.” 18. ProceduresA procedure consists of different modules. The procedures can be used, for example, to implement instructions for relaxation, a stress test, a defined biofeedback training session or tasks for research purposes. The possibilities are manifold. During a procedure, your heart rate variability is naturally recorded. At the end of a procedure, a summary is displayed, showing your readings for each module and the overall view.  We recommend that you try the demo procedures included in the app. These give you a guided overview of the different modules and functions. The included procedures are also protected by a password in order that those can’t be edited or deleted by accident. You can any time create a copy of those procedures without a password and change it as you wish. We also explain in detail how you can create and edit your own procedures in the chapter procedures settings. 19. Open TrainingAs a second option you can also conduct an open training. This is compared to the procedures a bit more complex. We therefore explain a typical open training session which consists of 4 training phases. Preparation and start
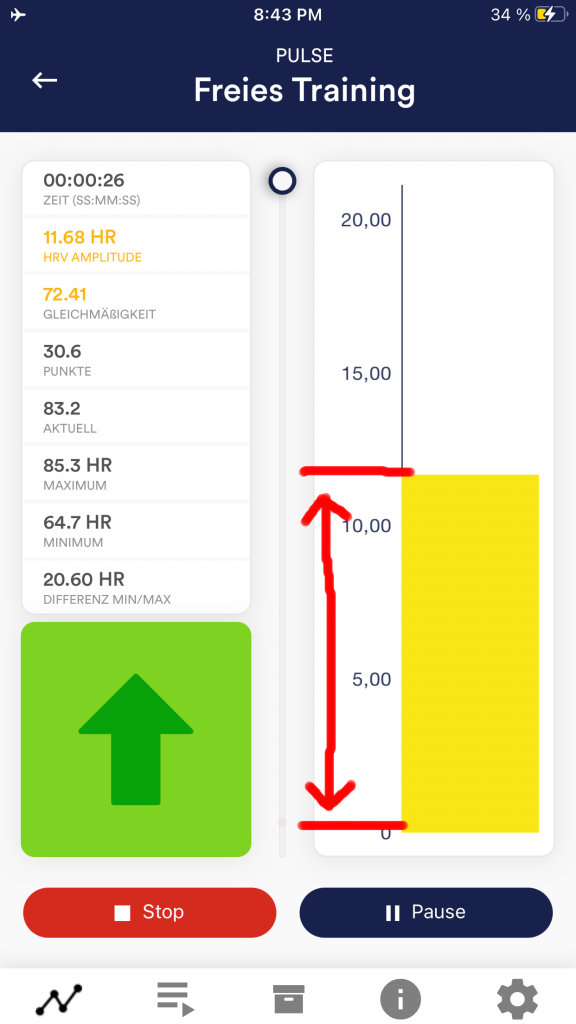
First stage (observe and experiment; determine your initial status)
Second training phase (targeted biofeedback training based on the measured values)
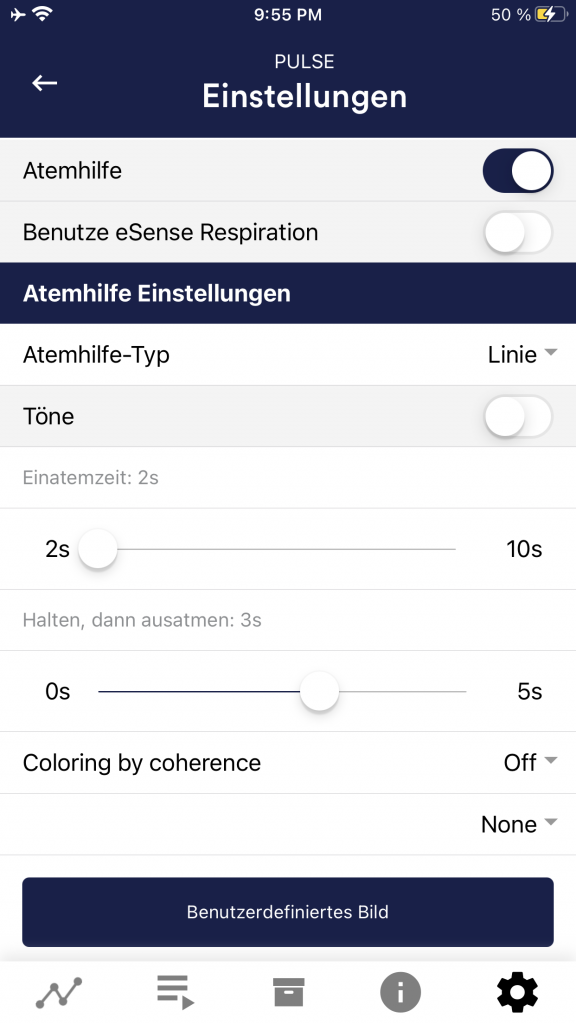
Practice an increase in heart rate variability, including the breathing aid. You can activate the breathing aid in the app settings, it is not active by default. Activate it and start breathing training at your usual breathing rate. This will, in most cases, be between 12 and 15 breaths per minute. This is faster than quiet breathing during deep relaxation. However, it is easier to start with your “normal” breathing first and then gradually slow down your breathing pace to below 10 breaths per minute. Set the inhalation and exhalation times in the breathing target as desired. (For 15 breaths, set 2 seconds for inhalation time and 2 seconds for exhalation time, or 3 seconds for inhalation and exhalation time if you want to try 10 quiet breaths per minute). It is helpful to breathe out a little longer than in.
 (5 Sekunden pro Atemzug / 12 Atemzüge pro Minute)
Third training phase (provocation, relaxation and stress management)
Fourth training phase (transfer, relaxation even without feedback)
20. Kubios HRV SoftwareThe Kubios HRV Premium Software offers you detailed HRV-analysis with its over 40 analysis parameters and can be perfectly combined with the eSense Pulse. You can easily import an eSense Pulse CSV file from our eSense app into the Kubios software. Analysis of your measurements with Kubios Some parameters (e.g. SDNN, RMSSD, pNN50) are measured different in the eSense app than in the Kubios software. You can adjust the settings in Kubios so that the data are identical. To do this, you must ignore all header lines up to line 34 in the settings. Select column 3 (which contains the RR intervals in milliseconds) as the data column.  21. Smart Bulbs (optional)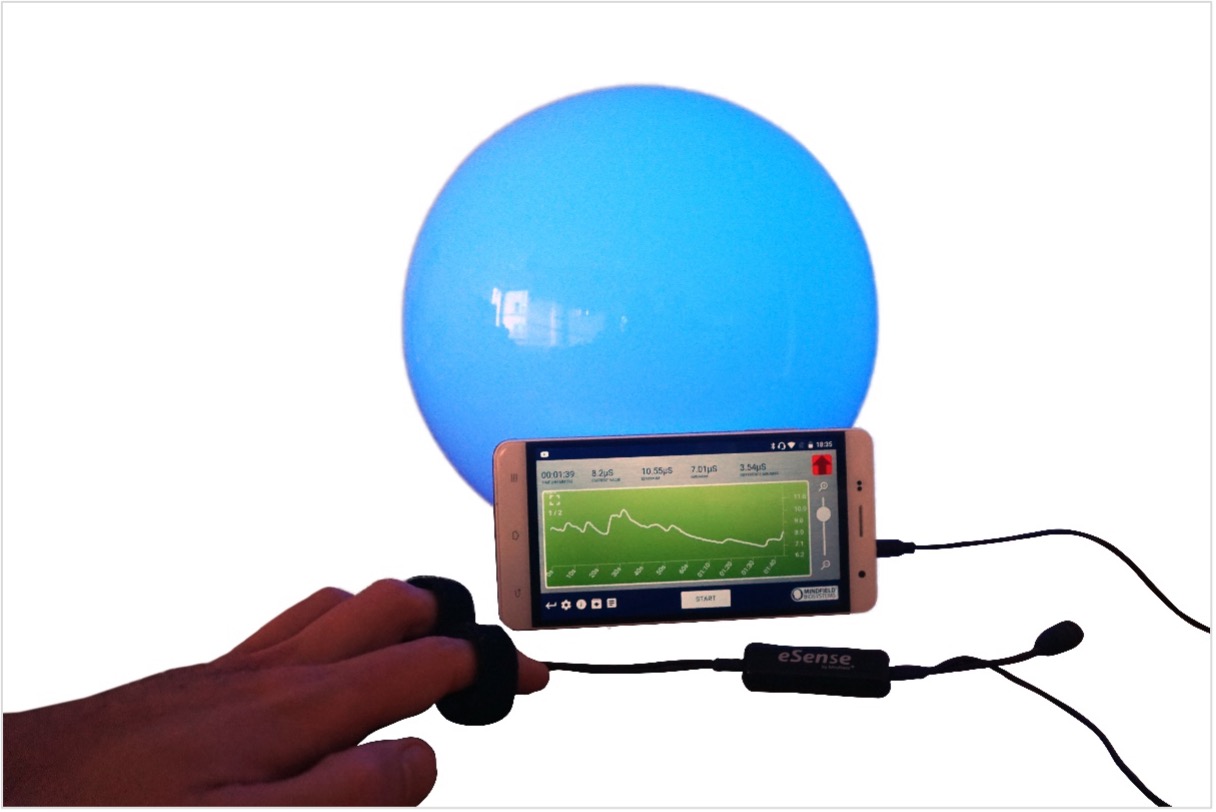 The eSense app can use smart bulbs as a visual biofeedback channel: the colour and brightness of the bulb react in real time to your measured values. This way you can see your level of tension or relaxation directly in the light in the room – in addition to or instead of the feedback on the screen. This works with all eSense sensors. Recommendation: Philips HueFor light biofeedback we recommend the Philips Hue. In general, all Philips Hue products are compatible with the eSense app. For coloured feedback, the models in the “White and Color Ambiance” range are particularly suitable. As the best bulbs for biofeedback we recommend the Philips Hue Go and the Philips Hue Bloom: both produce coloured light, are compact and work well as mood lighting right at your training spot. The Hue Go can also be used on the move thanks to its battery. Two ways to connectYou can connect the Philips Hue to the eSense app in two ways:
You will find the exact setup for both variants, as well as recommendations on the number of bulbs and the range, in the Philips Hue FAQ. The use of the Philips Hue is available in the eSense app as an in-app purchase (see In-App Purchases). Colour and brightness logicSince version 8, the eSense Pulse, the breathing trainer and the Hue light use a unified colour and brightness logic: the colour and brightness of the bulb follow the same scheme as the feedback in the app and change according to your measured value or the training phase. This keeps the visual feedback consistent across screen and bulb. Magic Blue (discontinued)The Magic Blue was formerly Mindfield’s own smart bulb. It is no longer produced (end of life). For existing customers, the Magic Blue function remains usable in the eSense app; for a new purchase, however, we recommend the Philips Hue. Notes on connecting the Magic Blue can also be found in our helpdesk. 22. Philips™ Hue™ FAQWhich products from Philips Hue can I use with the eSense app?In general, all Philips Hue products are compatible with our eSense App and therefore can be used together with the eSense. We tested the most common products:
For the best experience, we recommend the Philips Hue White and Color Ambience, because with the colors, the feedback can be enhanced more than with only white colors. Especially we recommend using the Philips Hue Go, as it is mobile with battery and a very nice, complete lamp. How do I connect to the Philips Hue within the eSense App?You have 2 options: You can connect the Hue in the eSense app via the bridge with Zigbee or directly via Bluetooth (which is mainly the case with the newer Hue lamps). To connect to the Philips Hue products, open the eSense app and follow these steps:
How do I connect the Philips Hue within the Hue App?
How many Philips Hue bulbs/products can I use with the eSense app?We have successfully tested up to 9 products/bulbs (mixture of different type of bulbs, Hue Go and LightStripe). However, from 3 products and more the reaction time of the products/bulbs slows down significantly (Philips enables a maximum transfer speed of 100ms per signal and per bulb). Especially if you use several bulbs, a short distance to the Philips Bridge, the bulbs and your smartphone or tablet becomes more relevant. See also the next question about this. How far can the Philips Hue, the Hue Bridge and the smartphone or tablet be away?Usually the range is between 30 and 100 meter, depending on the environment. The range is less with objects in between (for example a wall in between can decrease the range). Also, if the Hue Bridge and your modem should be in another floor level, it can influence the range. However, the transmission of the signal by Philips is good enough so that there weren’t any problems with our tests in normal households with the signal. Just from 4 (and more) bulbs at the same time a recognizable lag can occur, see also the question above about this. A warning will be displayed in the app if you want to use more than 3 lamps at the same time. Where can I buy the Philips Hue products?You should be able to find the Phillips Hue in every well-sorted electronic store. You can also order it online. A list of the on- and offline-merchants can be also found on the page of the Philips Hue: https://www.philips-hue.com/en-us We suggest one of the starter kits from Philips for the use with the eSense. This also contains a colored bulb (‘White and Color Ambience’): https://amzn.to/3uzSFx8 How do colour and brightness change?Since version 8 of the eSense app, the eSense Pulse, the breathing trainer and the Philips Hue light use a unified colour and brightness logic. The colour and brightness of the bulb follow the same scheme as the feedback on the screen and change according to your measured value or the current training phase. This keeps the visual feedback consistent across screen and bulb. 23. Magic Blue FAQI can no longer find the Magic Blue in the Mindfield Shop.Unfortunately, the Magic Blue is no longer in production. We have extended the eSense app to enable the use of Philipps Hue smart bulbs, which can be controlled via Bluetooth. How do I connect to the Magic Blue?You connect to the Magic Blue from inside the eSense app. To connect to the Magic Blue, open the eSense app and follow these steps:
After you have followed these steps, the app will remember the Magic Blue you have chosen (you usually don’t need to follow these steps again, unless you want to use another Magic Blue). You should not pair the Magic Blue by the device generic Bluetooth® settings. What can I do, if connecting to Bluetooth® fails or the Magic Blue is not found?Restart the Magic Blue (switch the switch of your lamp off and on again). Especially if the Magic Blue is already switched on more than 1 minute, the Magic Blue stops sending the Bluetooth® signal to connect. Restarting activates the signal again and the Magic Blue can be found. Why can’t I find the device when scanning for Bluetooth® devices?Check the light from the Magic Blue to make sure the Magic Blue is switched on. If there is metal around the Magic Blue (for example a lampshade around the Magic Blue), it could shield the Magic Blue and block the signal. Make also sure that the Magic Blue is not connected to another phone or tablet already since the Magic Blue can just be connected to one phone or tablet at a time (see also next question). How many Magic Blue bulbs can I control at the same time?You can control one Magic Blue at the same time. How far can the distance between Magic Blue and phone or tablet be?Usually the range is 18 to 30 meters without any objects in between. It will be less with objects between the Magic Blue and your phone or tablet (for example a wall between the Magic Blue and the smartphone or tablet can decrease the range). How can I reset the Magic Blue?Just follow this video to do so: 24. Functions of the Mindfield eSense App The eSense comes with the Mindfield eSense app, which you can download for free from the Google Play Store (Android) or the Apple App Store (iOS). With version 8, the app has been rebuilt on a completely new technical foundation (Capacitor 7) – with more stability and a tidied-up user interface. It offers a wealth of features for effective biofeedback training: display of the measured values as a bar graph and oscilloscope, feedback via video, music, sound or vibration, a comprehensive evaluation after each measurement, as well as comparing measurements in the archive and exporting them as a CSV file and PDF report. Features at a glance (version 8.x)
The app is available in 14 languages: German, English, Spanish, French, Italian, Japanese, Dutch, Polish, Portuguese, Turkish, Ukrainian, Chinese, Hungarian and Russian. The language is selected automatically at startup based on the device setting and can be changed on the start screen (see Changing the language in the app). Download links:   iOS: https://itunes.apple.com/us/app/mindfield-esense/id1141032160?mt=8 Android: https://play.google.com/store/apps/details?id=com.mindfield.boisystem.esense 25. General notes
In following the app is described in full details. 26. General view & Open TrainingPortrait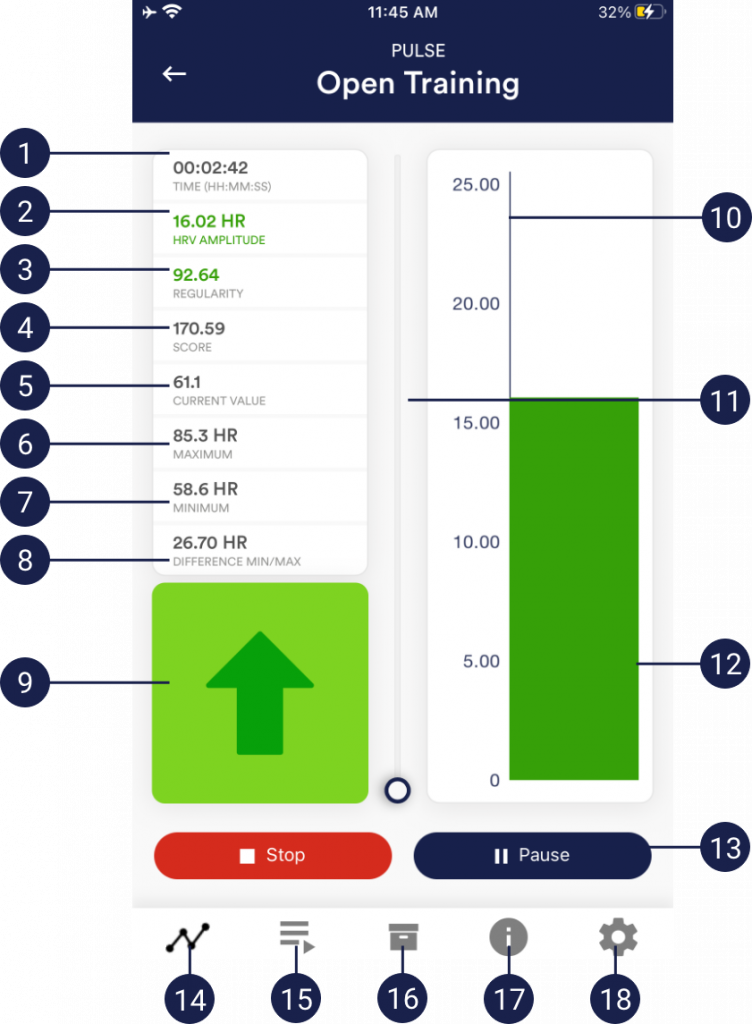
Landscape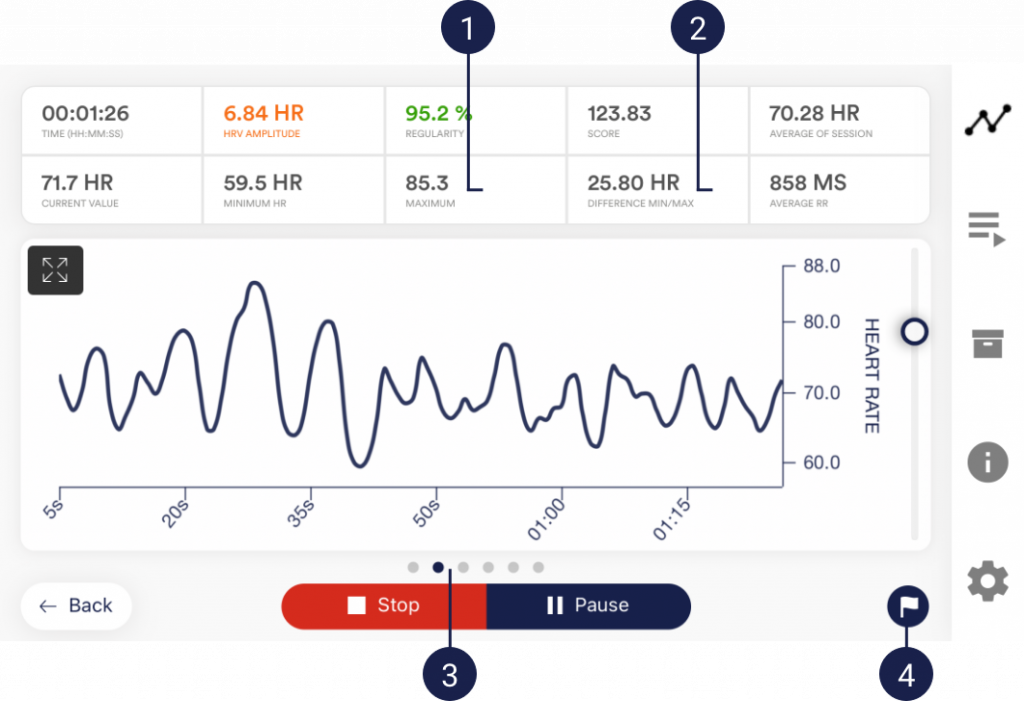
27. Breath Pacer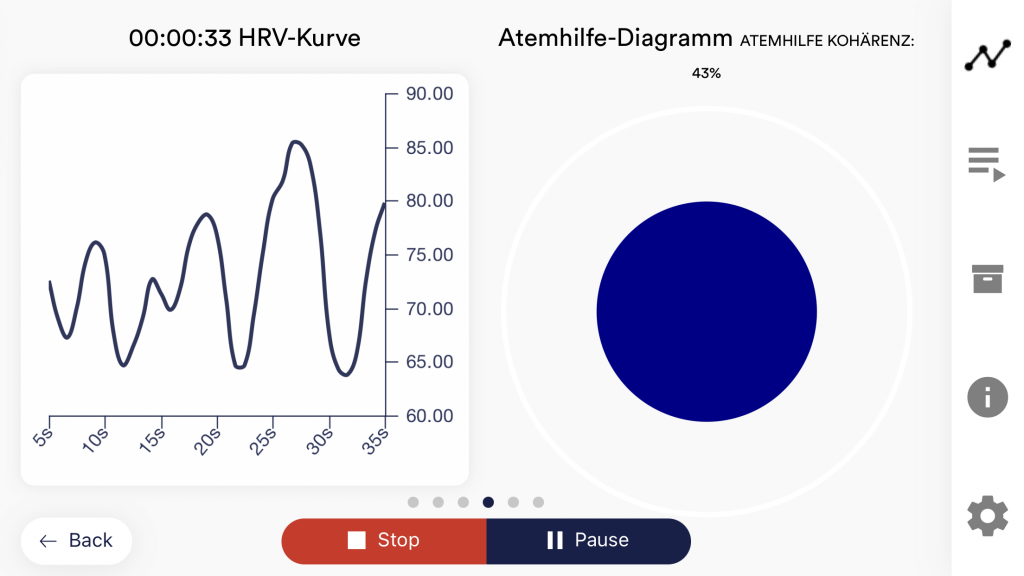  Breathe as the sphere expands. With growing ball breathe in, with shrinking ball breathe out. The coherence (here 68%) shows you how much your heartbeat follows the breathing, the higher the value, the better. 100% cannot be reached. Once you are over 50%, there is a correlation between heart and breath. Try to get as high a value as possible and experiment with different breath time specifications. 28. Biofeedback Snake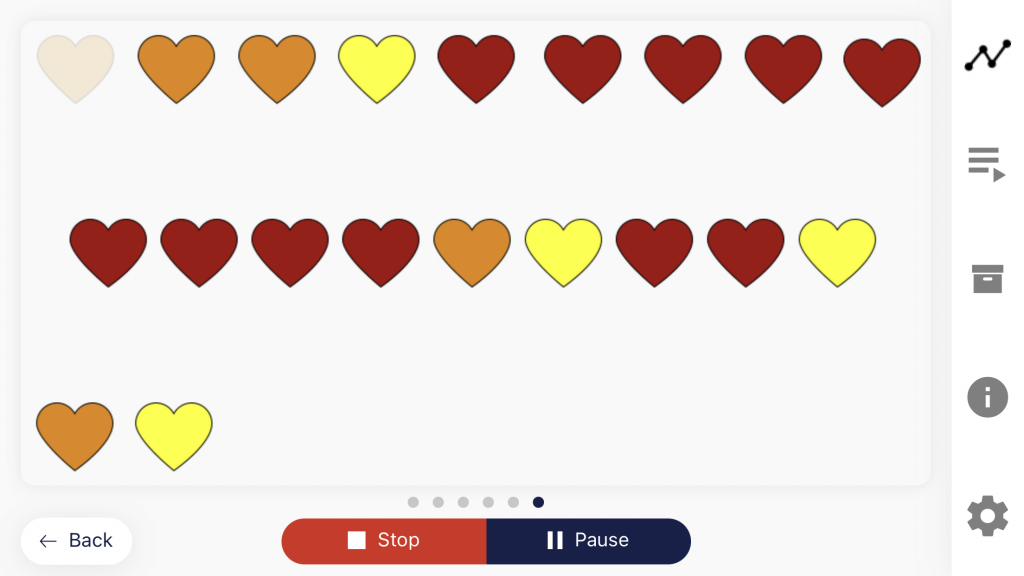 You can also display the Biofeedback snake as an additional option. At the top left are appearing symbols which vary in color depending on the current measured value.
After 10 green symbols you will also be rewarded with a star and after 50 green symbols even with a shooting star. If the snake goes over the entire screen you will see the last 5 minutes. 29. Spectrogram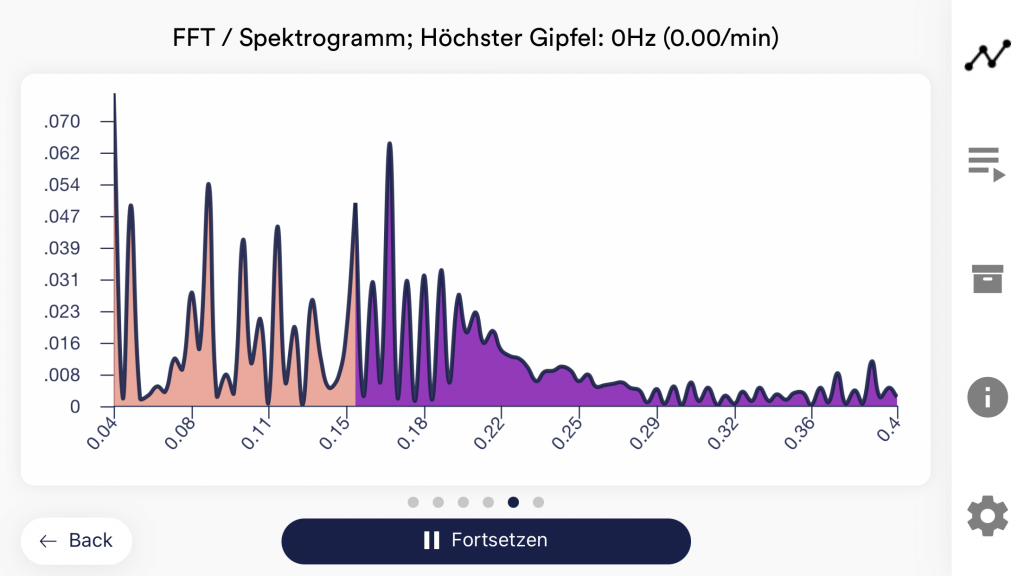 The spectrogram shows how often the respective RR intervals (also NN intervals, the distance between two heartbeats) occur. This provides information about the proportion of sympathetic and parasympathetic heartbeats. The spectrogram shows frequency bands from 0.04 to 0.4 Hz. The number of RR intervals of each frequency band is counted and plotted on the spectrogram. The skin-colored range shows the low RR intervals (0.04 Hz – 0.15 Hz, sympathetic range) and the purple range shows the high RR intervals (0.15 Hz – 0.4 Hz, parasympathetic range). The spectrogram is calculated using a Fast Fourier Transformation (FFT). Simply put, with this graph, you can see how even the RR intervals are. Optimally, you have only one (or a few) distinct peak(s) in the skin-colored area and only one (or a few) distinct peak(s) in the purple area. This indicates that your RR interval repeats regularly in both the low (sympathetic) and high (parasympathetic) frequency ranges without large deviations. Further information on the RR interval (NN interval) and the significance of the low and high frequency ranges can be found under “Explanation of the individual measured values” in this manual. 30. Survey (optional)If you have activated this option in the general settings, a small survey will appear immediately after each measurement. This allows you to archive measurements that are reproducible in the long term or to document a change in your measurements. (If you for example start to use the eSense while lying down instead of sitting down). 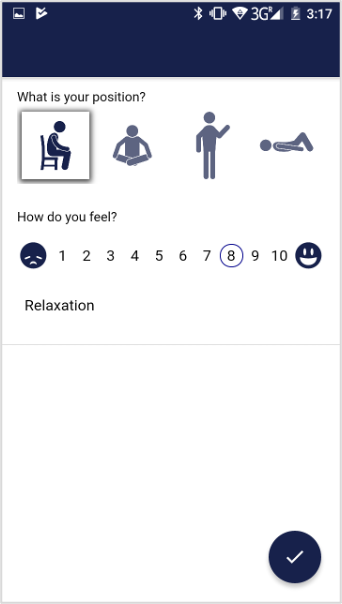 Your position during measurement How do you feel? Note function, optional 31. Pie chart (after the measurement)After the measurement (and optional questioning), in landscape format, a screen appears with a pie chart: The time in percent of the regularity of your HRV curve. In addition, additional values from the entire measurement are listed for you again. At this point, you can also swipe the screen to the left or right to switch between the pie chart and the graph of the measurement. 32. Procedure Overview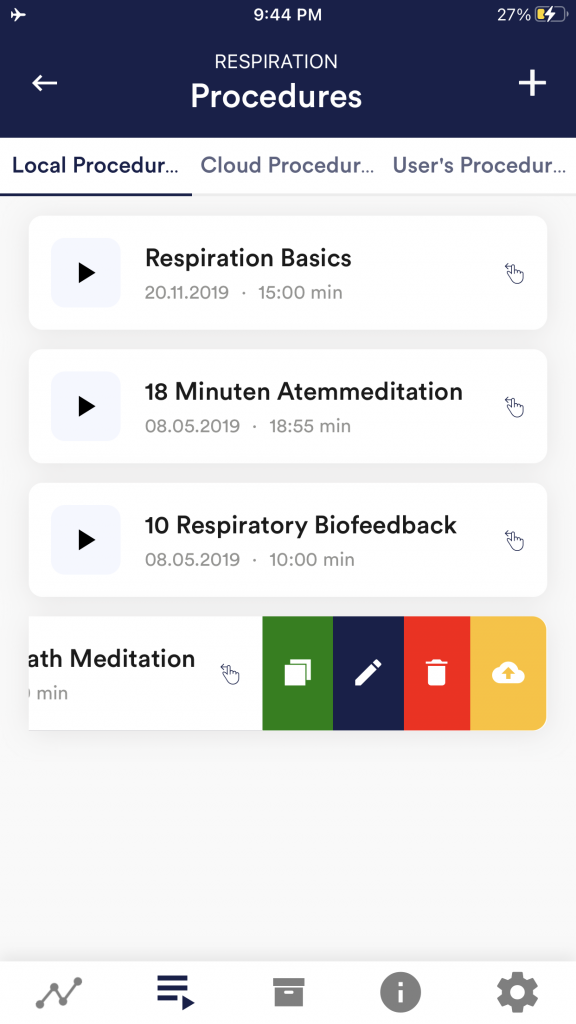 Edit or delete procedure To edit a procedure, simply swipe it to the left in the overview. You can then tap the blue pen-symbol to edit the module. If you want to copy the procedure, tap on the green copy-symbol. By touching the red trash symbol, you can delete the module. Sharing and transferring procedures (iOS ↔ Android)Since version 8 of the eSense app, procedures can be downloaded, uploaded and shared reliably – including across platforms between iOS and Android. This way you can create a procedure on one device and continue using it on another device or pass it on to other users. If the cross-device synchronisation via your cloud account does not work as expected, the article My procedures are not synchronised correctly will help. 33. Procedure editor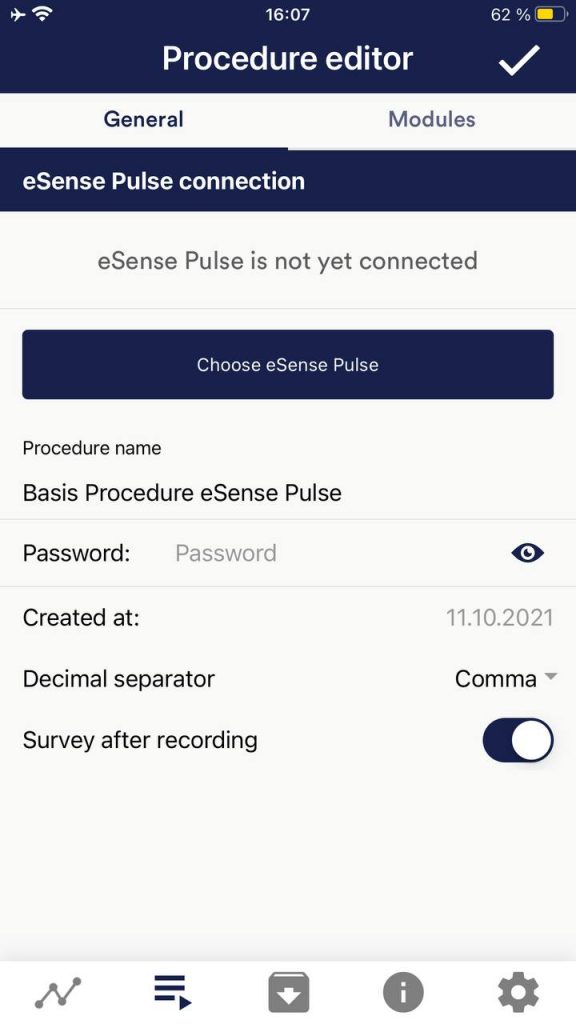 Procedure name Password (optional) Decimal separator Survey after recording 34. Add new module In the procedure editor, select the “Modules” tab. Add module to procedure Edit module 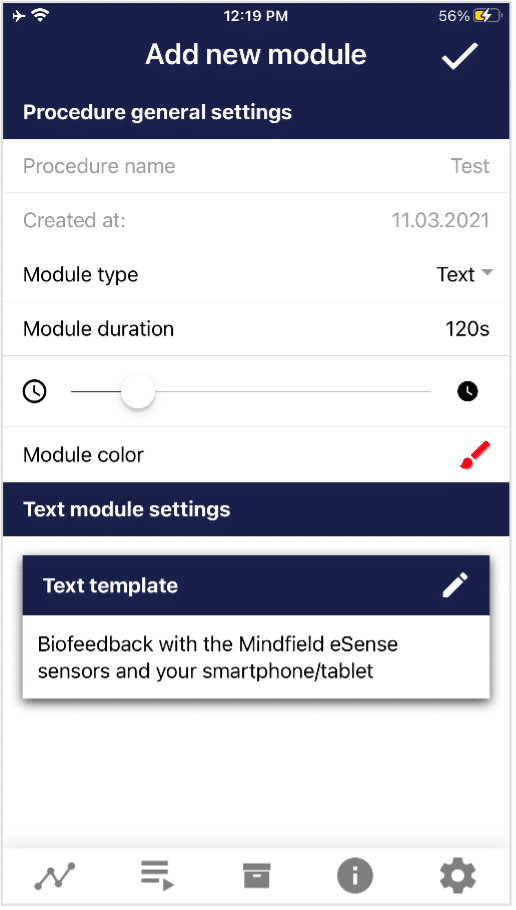 Module Type Module duration module color 35. Overview of the modules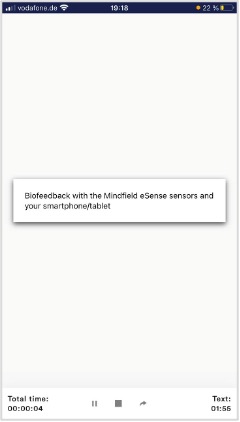 This module shows a text which you can edit. 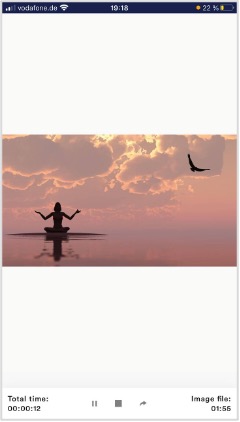 The picture module shows either a standard picture from the app or a picture from your gallery. 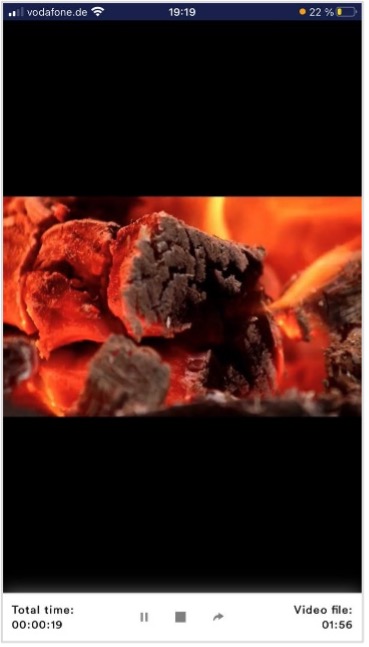 In the video module, you can choose either the standard video from the app or use your own video. 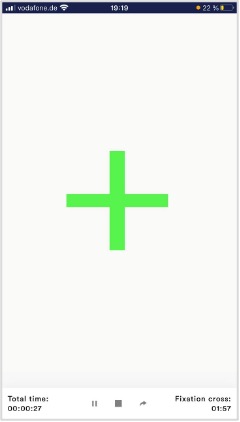 The cross changes its color depending on the conductance and provides direct biofeedback. 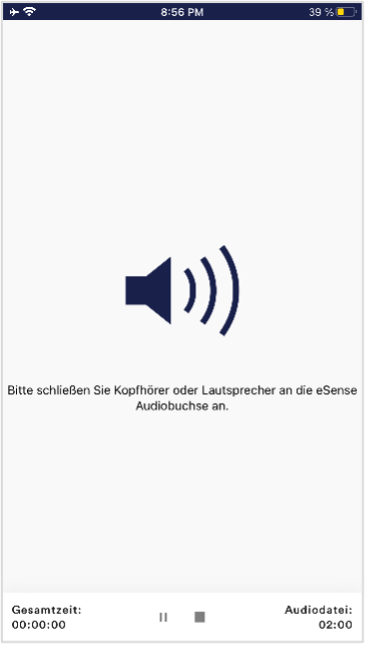 The audio module is playing a relaxing song. You can choose your own music. The arrow changes depending on relaxation and gives you direct biofeedback. 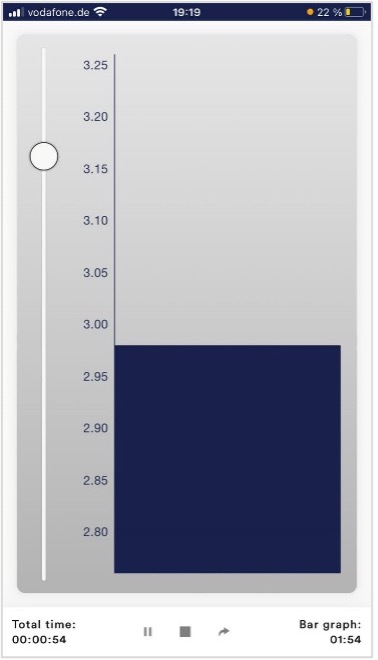 The bar graph shows you your current value and gives you direct biofeedback. 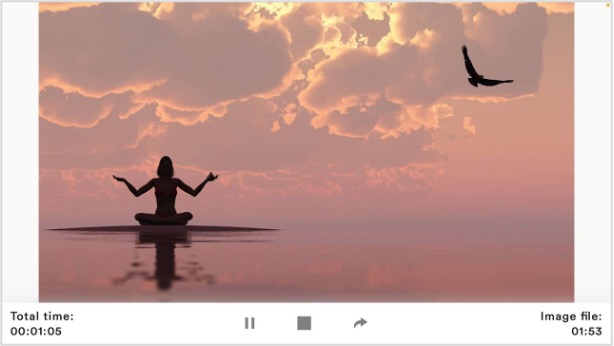 The procedures can be displayed also in landscape format. 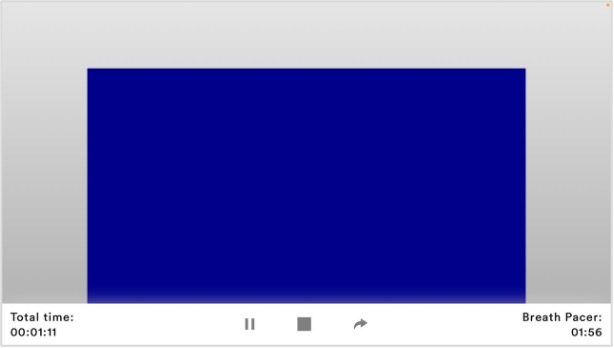 Breath Pacer module in landscape format 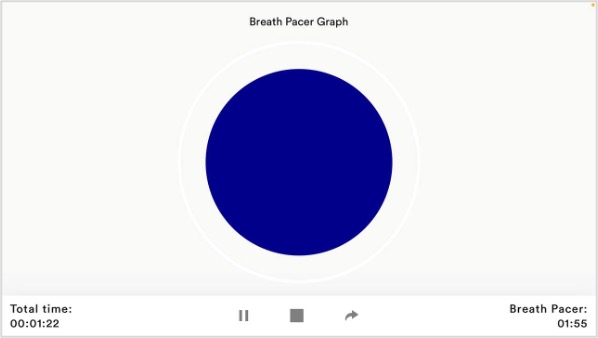 Osciloscope Type Breath curve (Sphere) 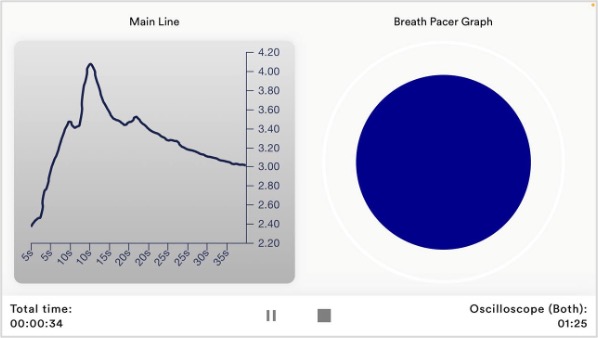 Osciloscope Type Both 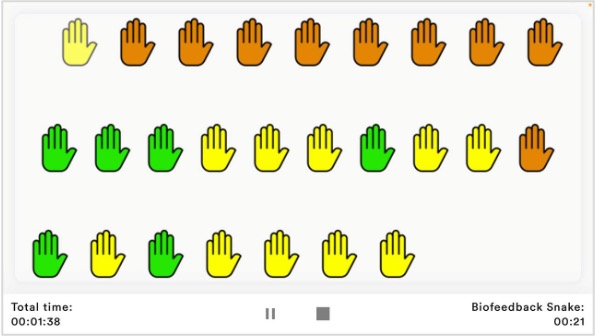 Biofeedback Snake The Biofeedback Snake is also available as module. 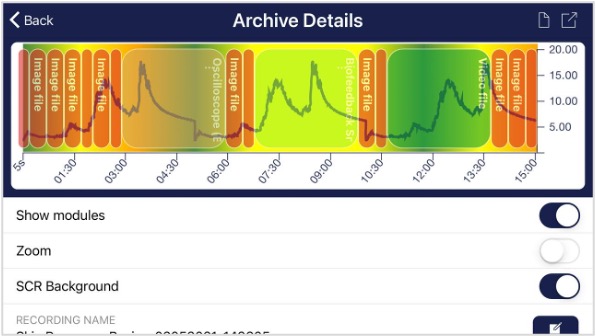 Procedure in the archive For more on the settings of the oscilloscope feedback channel (time window, curve smoothing, scale lock, full screen), see the article The oscilloscope. 36. Creation of a procedure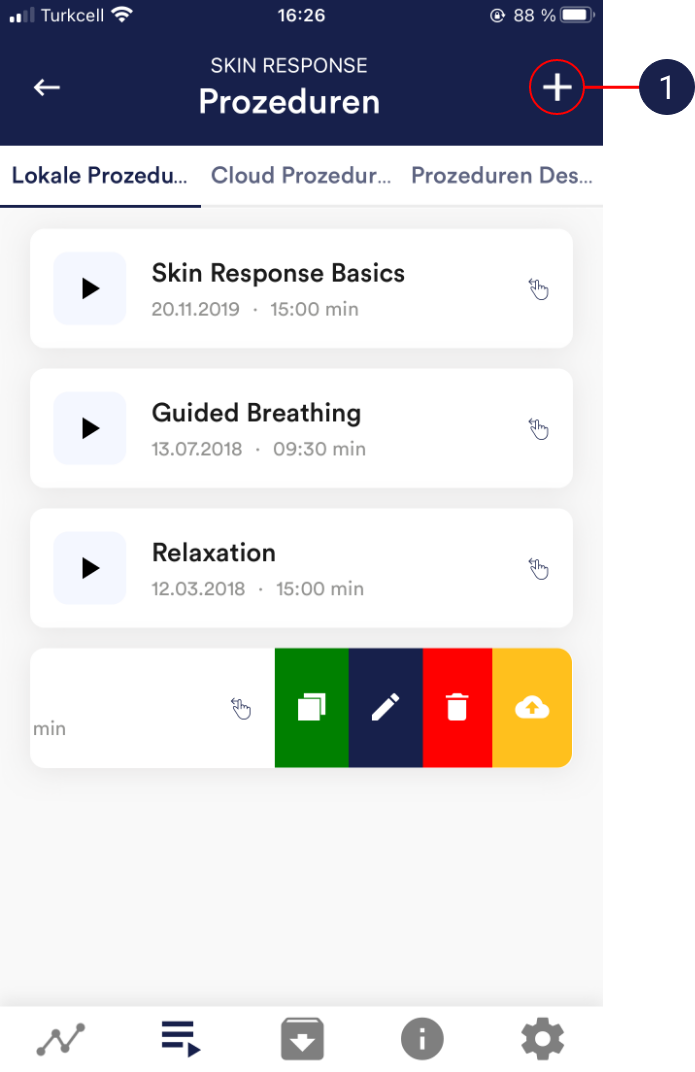 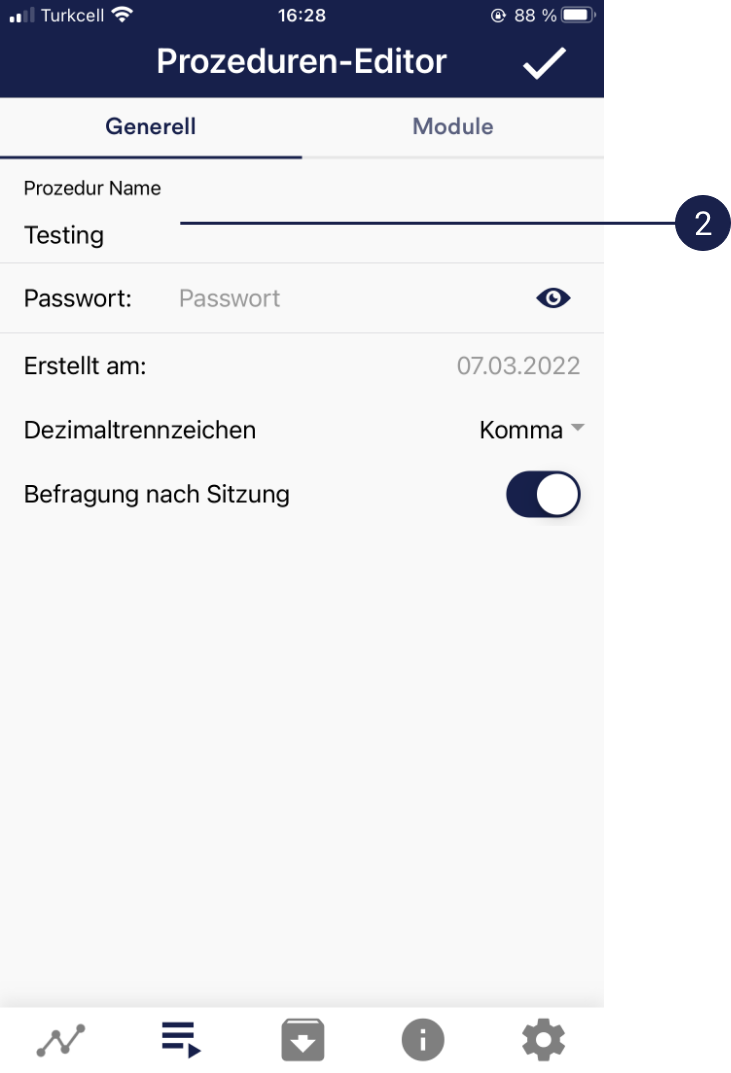 You can simply accept all other default settings for this example. 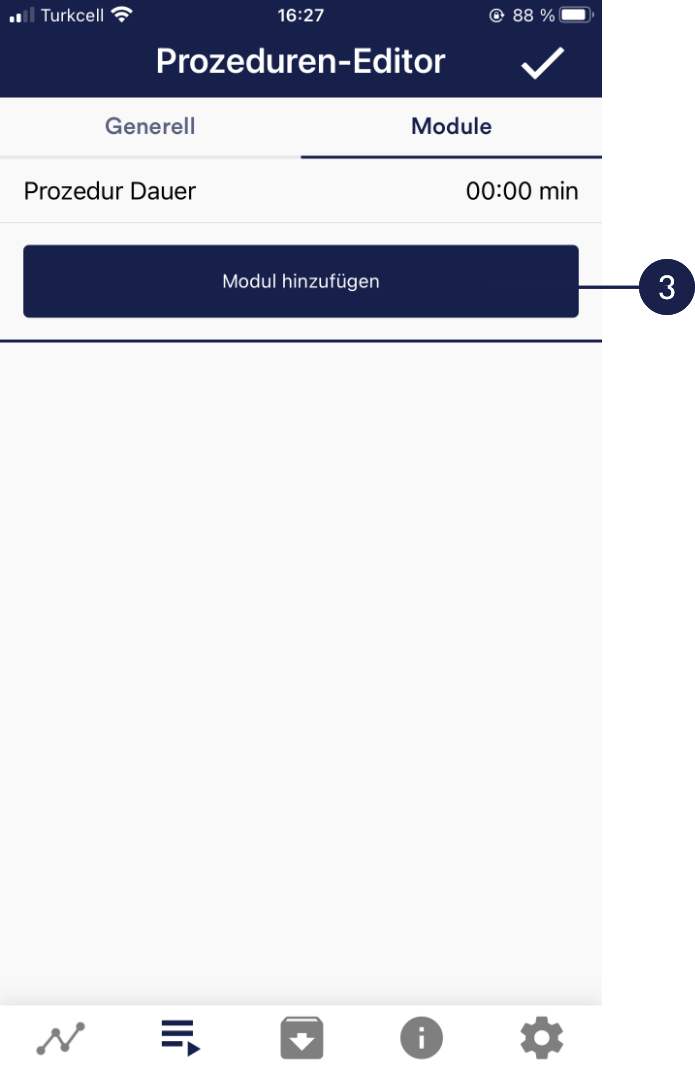 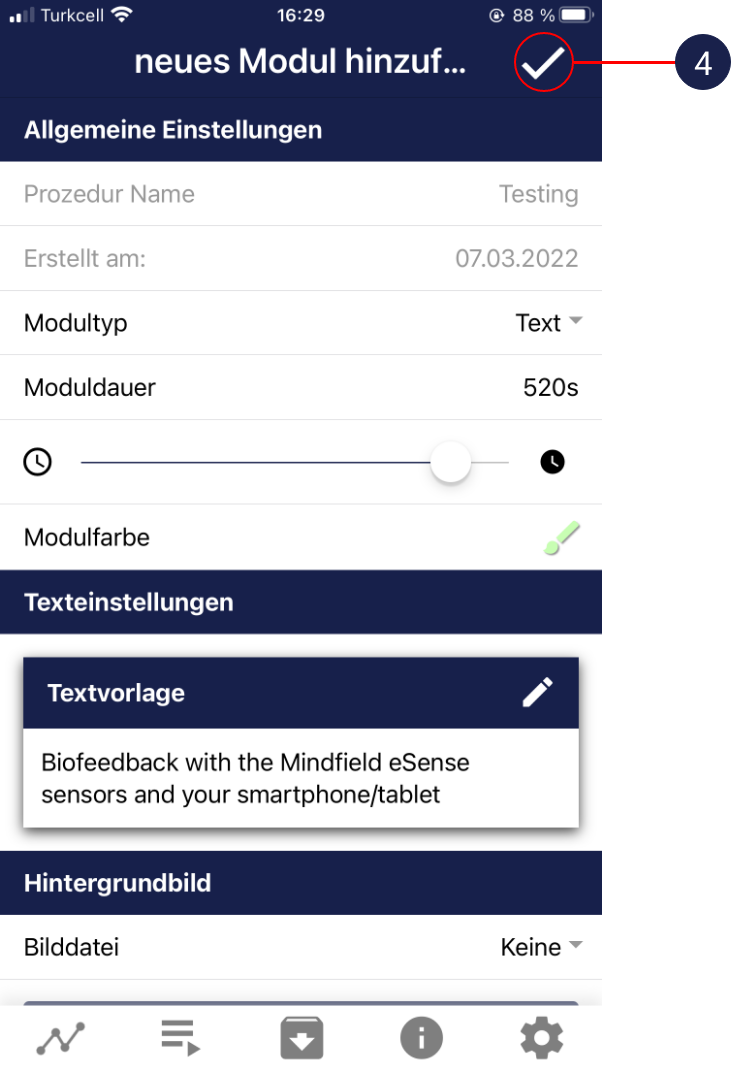   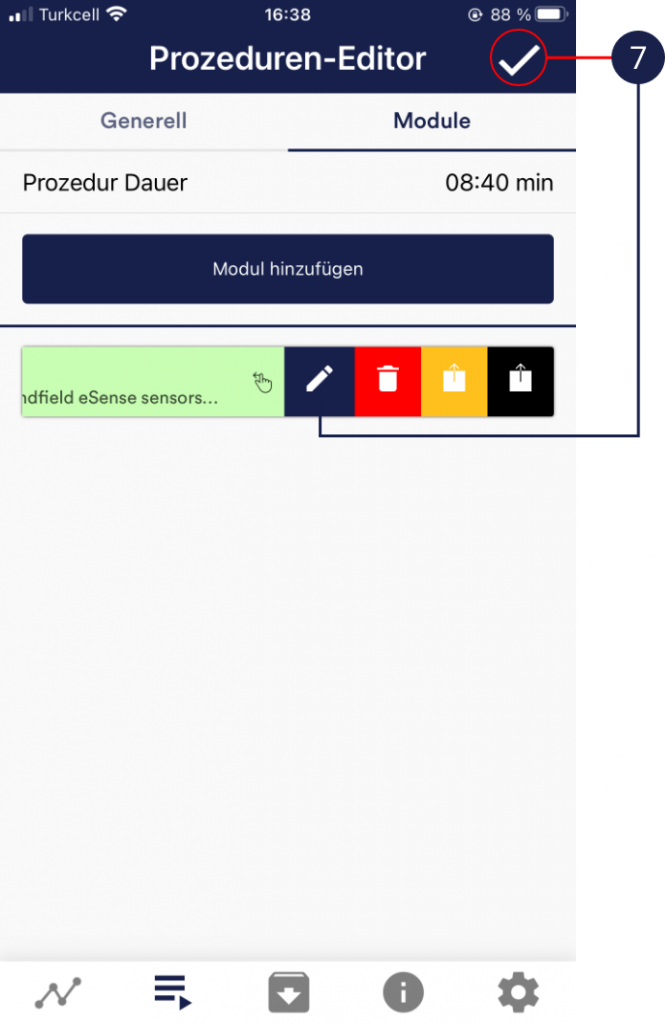  37. MeditationsYou can also choose one of our guided meditations as a procedure. The breathing meditation is already included in the eSense app. We will also offer more meditations shortly as new free cloud procedures for users with account. The meditations thus offer you an easy way to train your awareness and attention and, at the same time, receive biofeedback. 38. Own media (photos, videos and audios)You can use your own pictures in the picture module, your own videos in the video module or your own music or melodies in the audio module in the procedures. Android usually enables this without any further problems. As long as you allow the eSense app to access your files on your device, you can upload them to the eSense app. iOS is a bit more restrictive. As usual, you can use your pictures from your device in the iCloud for pictures and videos. For audio files you need iTunes (or an alternative such as “CopyTrans Manager”). This is where your music or melody must be. You can find your music in iTunes (or CopyTrans Manager) under the tab “My Sound” and insert it into your procedures. We have a detailed video at https://www.youtube.com/watch?v=A_CRbmBeBBc where we show all the steps. On iOS the power saving mode must also be deactivated, otherwise the videos in the procedures cannot be played. 39. General settings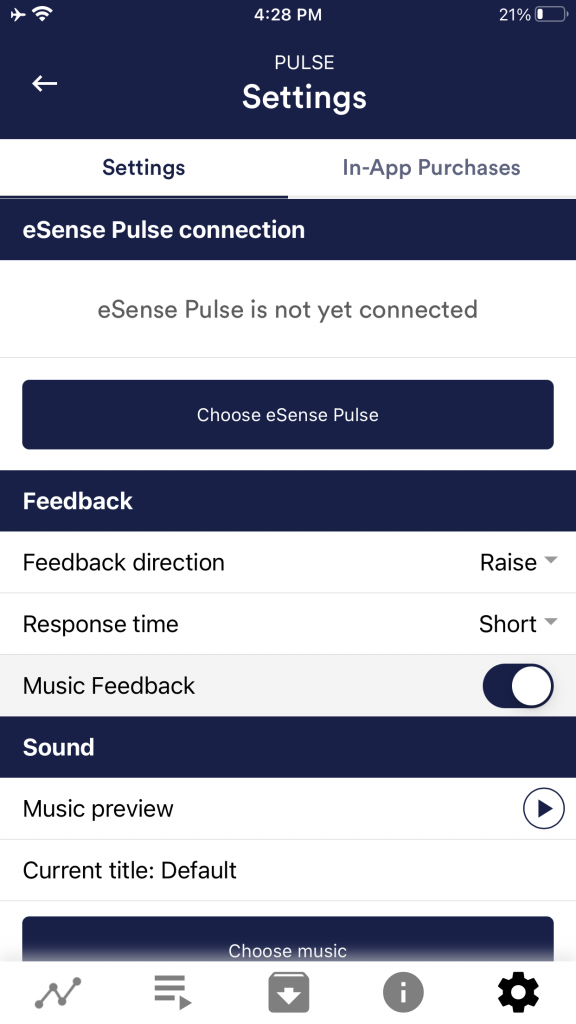 eSense Pulse Connection Feedback direction Response time Music Feedback Music preview Choose Music Music feedback type 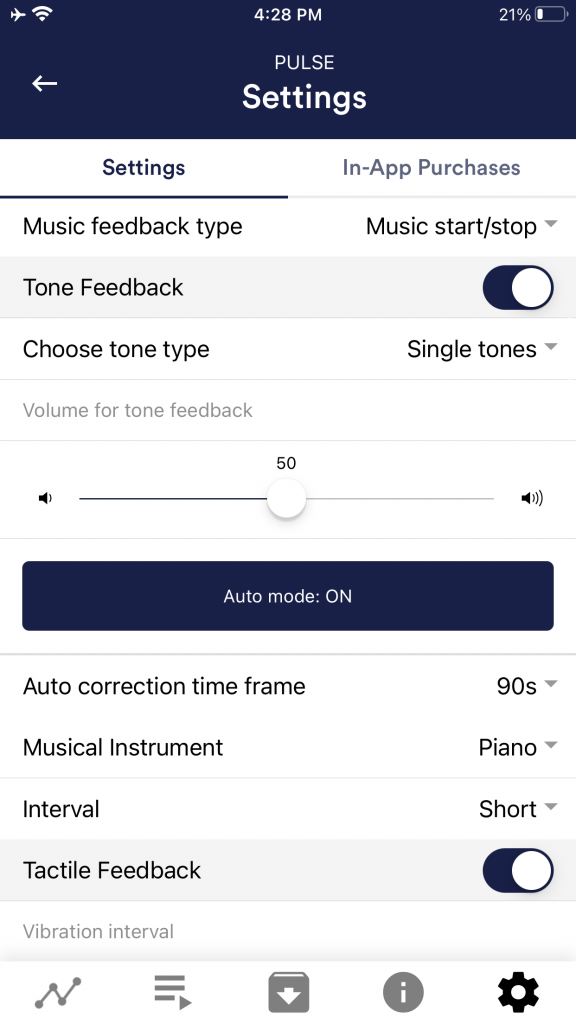 Tone Feedback Choose tone type Tactile Feedback 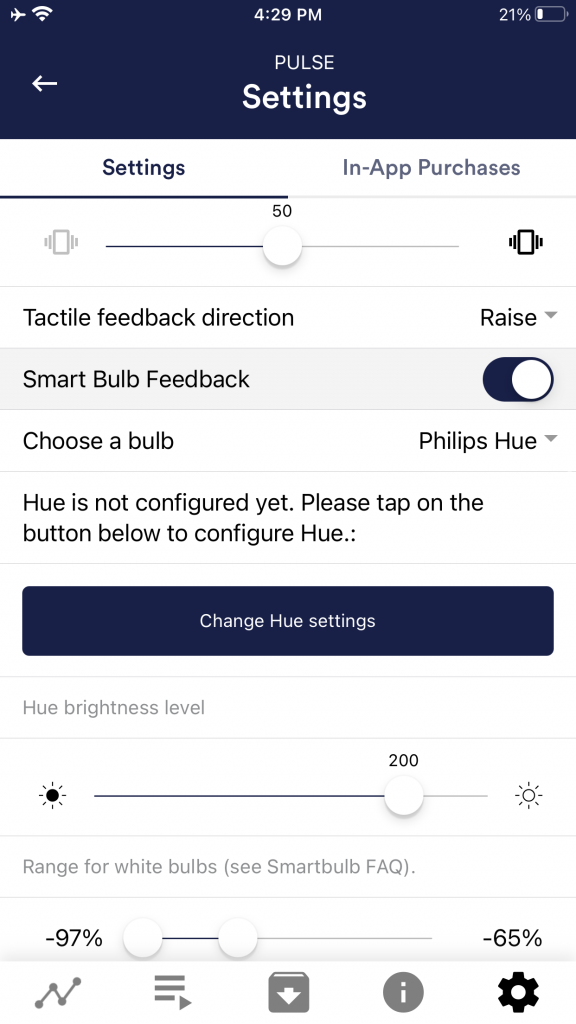 Tactile feedback direction Smart bulb feedback Choose a bulb 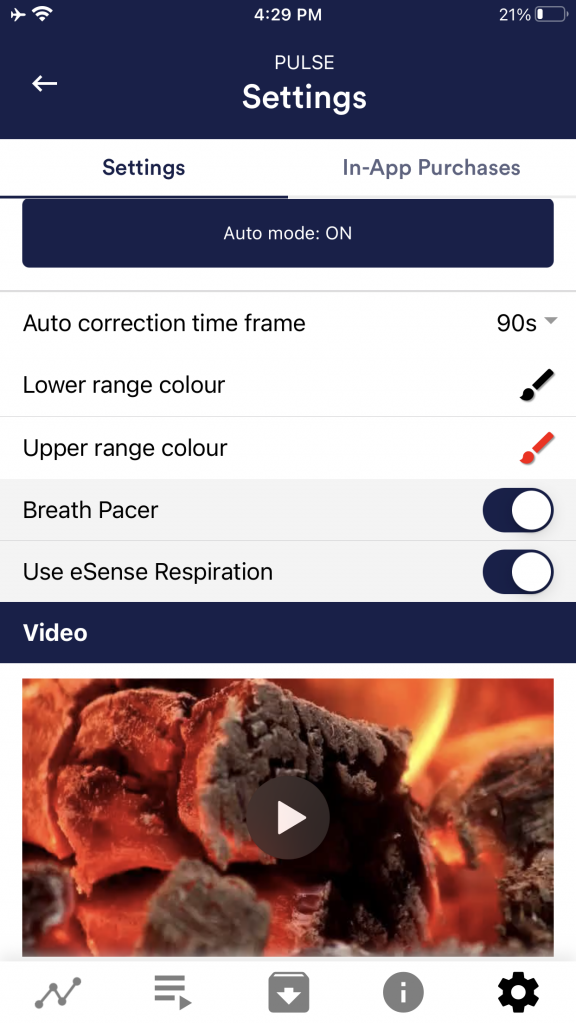 Breath Pacer Use eSense Respiration Breath pacer type Enable audio tone Inhale time / exhale time 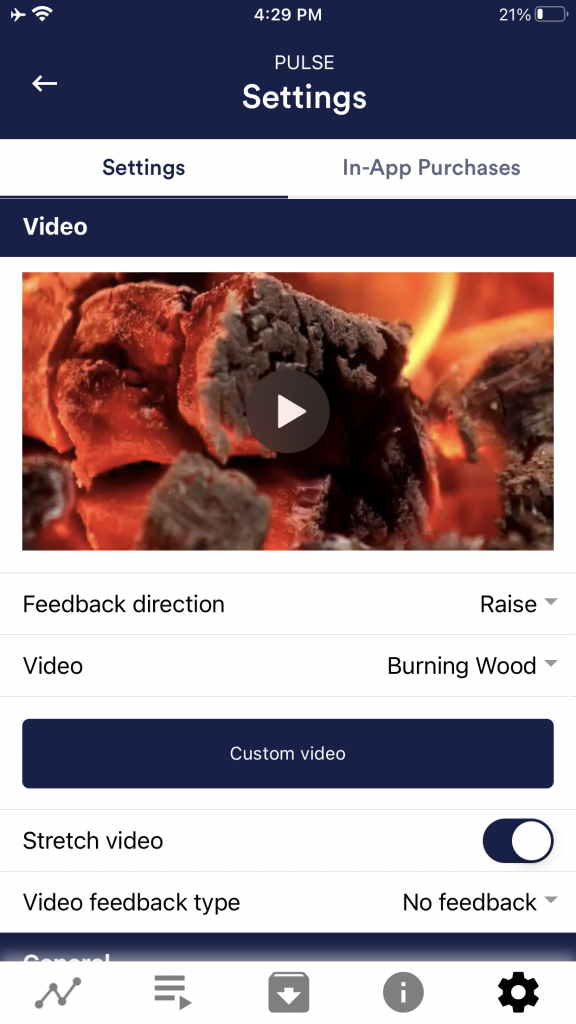 background image Inhale color / exhale color Video Video Feedback Type 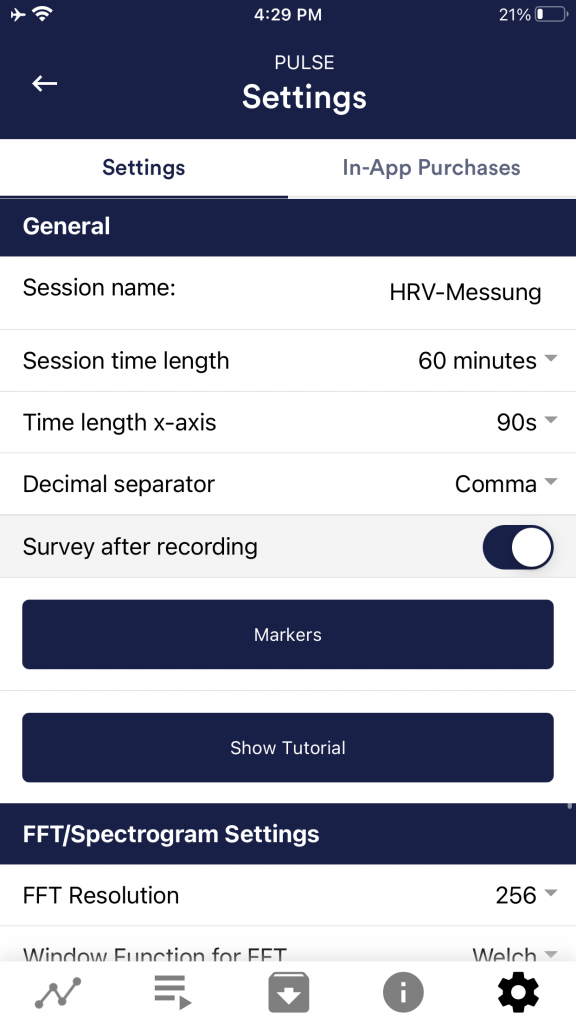 General: Session name Session time length Time length X-Axis Decimal separator Survey after recording Markers Show tutorial FFT resolution 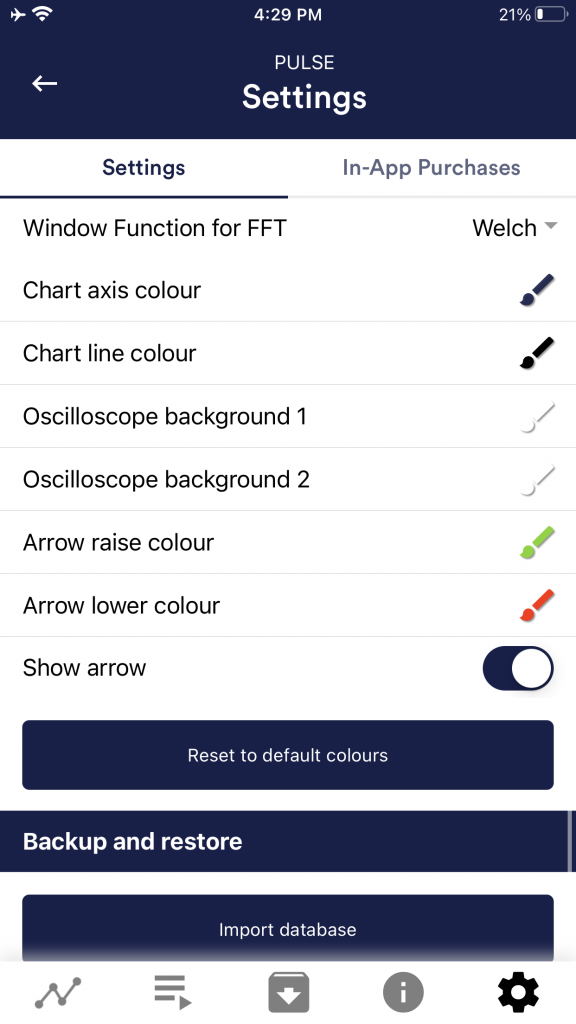 Window function for FFT Chart settings Chart axis color Chart line color Oscilloscope background 1&2 Smoothing of oscilloscope curve Reset to standard colors Arrow raise / lower color 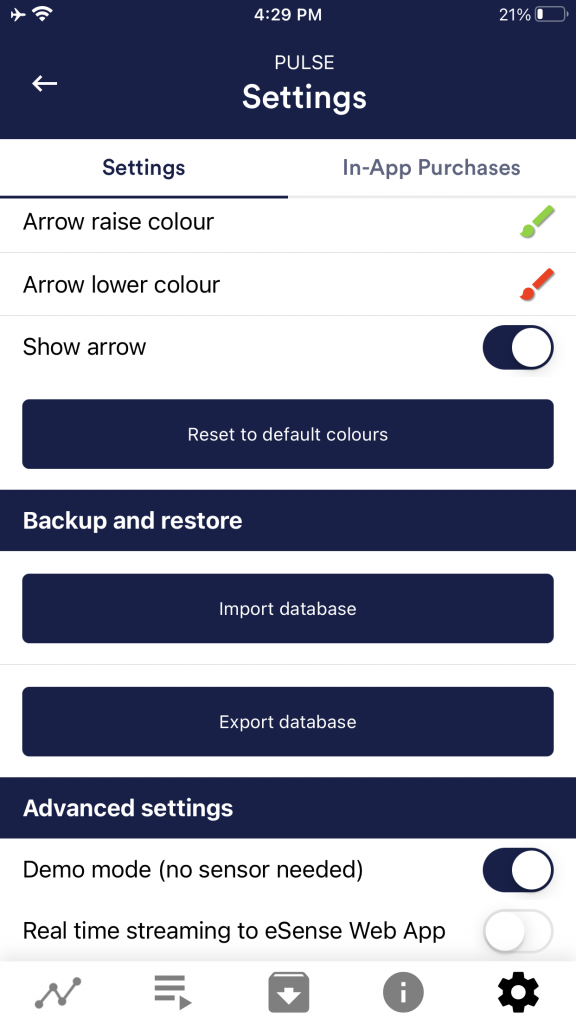 Backup & Restore Demo Mode
40. In App Purchases In-App Purchases Available in-app purchases at a glance
Restoring purchasesIf you switch devices or reinstall the app, you can reactivate your previously made in-app purchases via the “Restore purchases” function in the app settings. The prerequisite is that you are signed in with the same app store account you used to make the purchases. Promo CodeA Promo Code lets you unlock all in-app purchases of the app at once. To learn how to redeem a Promo Code, see Redeeming a Promo Code. 41. Archive (overview)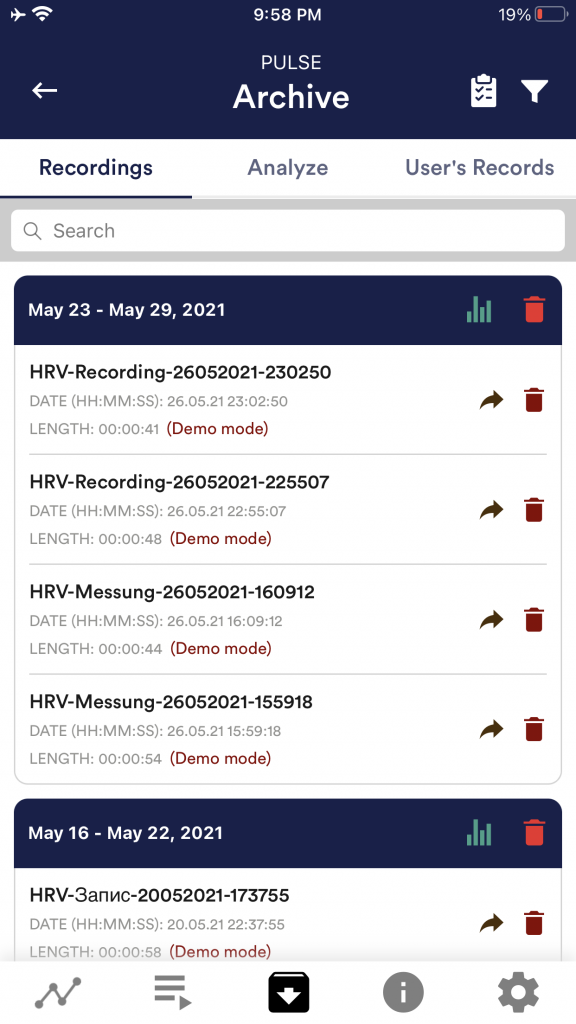 The app also contains an archive, in which you can save your measurements and export them as well. You can watch those in detail again, compare them to each other and export them individual or all together (as ZIP file). Recordings If you click on the clipboard symbol at the top right, you can mark one, several or all measurements. You can then export, analyze or delete the exported measurement (s). On the filter symbol you can choose whether you want to sort the measurements by name, date, length in ascending or descending order. If you want to delete a single measurement from this list, you can also tap on the trash can symbol to the right of the measurement. 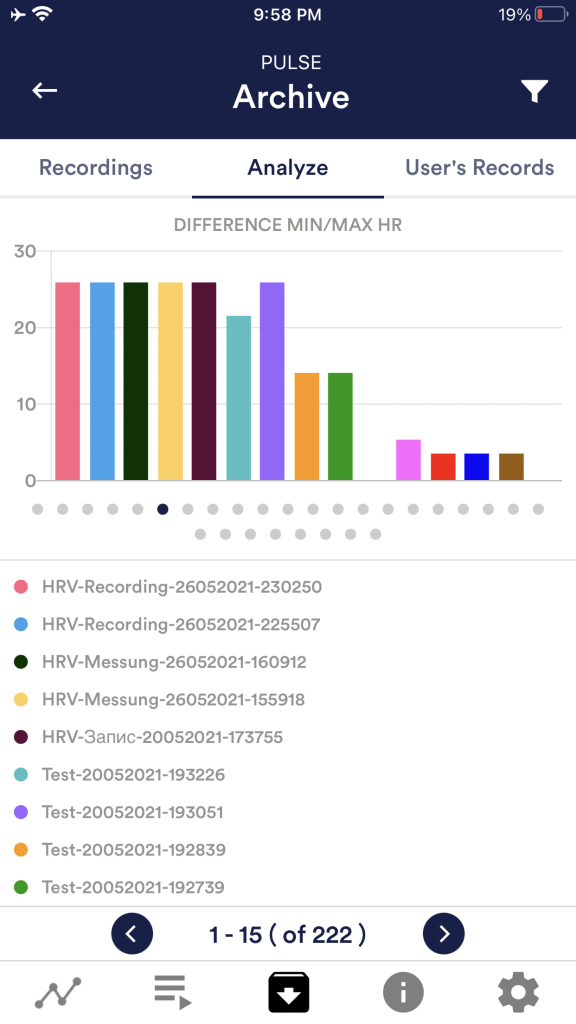 Analyze Time, score, average of session HR, minimum HR, maximum HR, difference min/max HR, SDNN ms, RMSSD ms, NN50, pNN50 %, stress index, average RR ms, Average HR. With this, you can recognize trends over time and over several measurements (if, for example, your % of SCR of Session decreases by regular training, you can see this here immediately). 42. Archive (single view) Export data Thanks to our export functions at the bottom of a recording, you can export the recordings in PDF or .csv format with all common apps (e.g. send via Messenger, WhatsApp, e-mail, etc.) or simply save them on your phone or in your cloud. The data are exported as a.csv-file (comma separated values). This format can be opened with Microsoft Excel or Open Office Calc (for free). If you like to work with Google, Google Sheets can be an alternative to Excel for you. You can open your exported .csv-files, visualize and access them via the cloud easily from several devices. Google Sheets has almost the same functions and interface as Excel. Note: We have also summarized more detailed information on CSV export and processing your data in an extra article on streaming and analyzing eSense data. 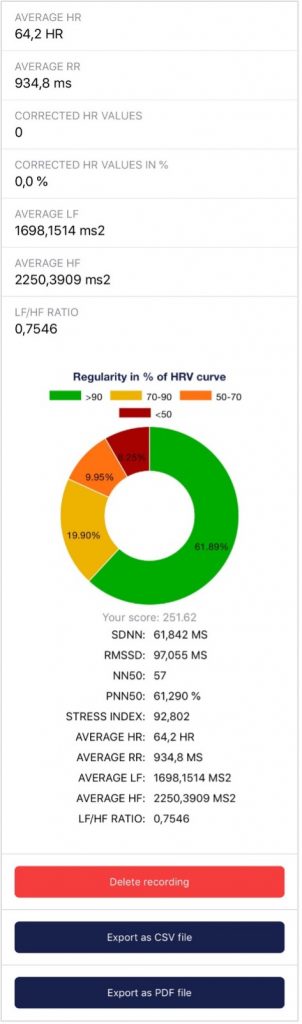 Regularity in % of the HRV curve You can see here also the Regularity of your measurement. This pie chart is the same as the one you see after the measurement. You can get more information about the regularity in the chapter ‘Explanation of the individual measured values’ in this manual. eSense Pulse analysis   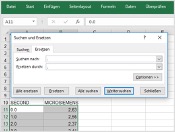 In Excel™ or Google Sheets™ Notice: If you open the .csv-file with Excel™ (or Google Sheets™) and your values make no sense, then there is usually a different set language in the eSense App and Excel™ and Sheets™. Note: We have also summarized more detailed information on CSV export and processing your data in an extra article on streaming and analyzing eSense data. 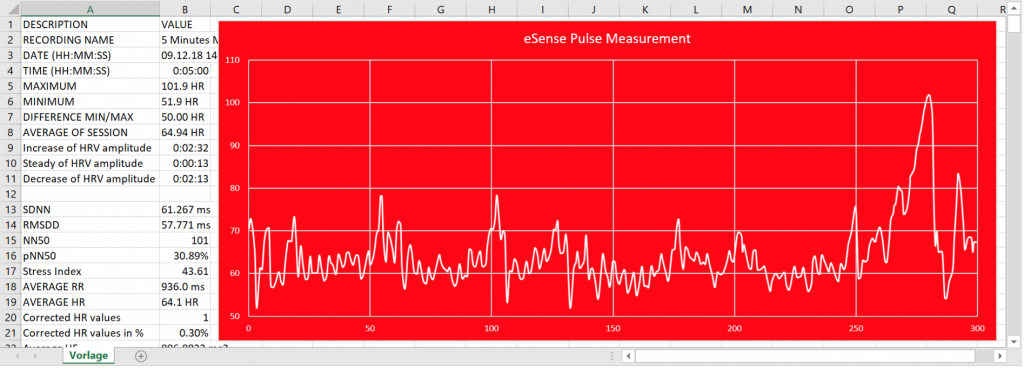 43. Marker featureYou can also set markers while you make measurements. For example, if you have a regular biofeedback exercise which involves breathing calmly at a specific point, you can set a marker in that moment when you breathe calmly. Later in the exported data, you can see the moment where you had breathed calmly. The marker feature comes in handy when you are making longer measurements with several actions. The markers can be displayed well in Excel:  44. Virtual Reality (VR) (f.i. Meta Quest 3)All our eSense sensors and our eSense app also work with VR (virtual reality) glasses. The prerequisite for this is a USB-C adapter (our recommendation: https://amzn.to/40eCoLR), which we now recommend anyway and which you can also order directly from us in the store with an eSense. The eSense app can be used as normal, with all its functions. After the one-time setup with SideQuest, no further special adjustments need to be made. In particular, the graph of the measurement as well as the photos and videos of the biofeedback training can be viewed in impressive detail with the VR glasses. We have created a video that shows the best way to use it: 45. Compatible Android and iOS devicesGeneralNote for all eSense: If you don’t have a device yet and/or want to buy an extra device for the eSense, we recommend depending on your taste either
or
According to our research, these options offer enough power for the eSense app, will remain upgradeable to the upcoming Android and iOS versions for some time, and are still reasonably priced. The Android devices also still have a normal 3.5mm jack input and do not require an adapter for the eSense. Starting from the iPad 10th generation (2022), the iPad Pro 3rd generation (2018), the iPad Air 4th generation (2020), and the iPad mini 6th generation (2021), iPads no longer have a 3.5mm headphone jack. From these models onward, you will need an adapter for the eSense. More information can be found in the general notice below under iOS. iOS devices compatible with the eSense
General note: Alternatively, you can use any other adapter with a DAC chip. We recommend this adapter on Amazon: https://amzn.to/2SnAUA1. We tested 11 alternative Lightning adapters from third-party vendors – only two of them worked. Therefore, we recommend either the original Apple Lightning adapter (https://www.mediamarkt.de/de/product/_apple-mmx62zm-a-2179668.html) or this compatible Lightning-to-3.5mm adapter, which we have successfully used with the eSense and also offer in our shop: Compatible Apple Lightning to 3.5mm adapter https://mindfield-shop.com/en/product/compatible-apple-lightning-to-3-5mm-adapter. Additional note Siri: Note for iOS devices and the eSense Pulse: Note for iOS 7 and later and the eSense Respiration, Skin Response, and Temperature: 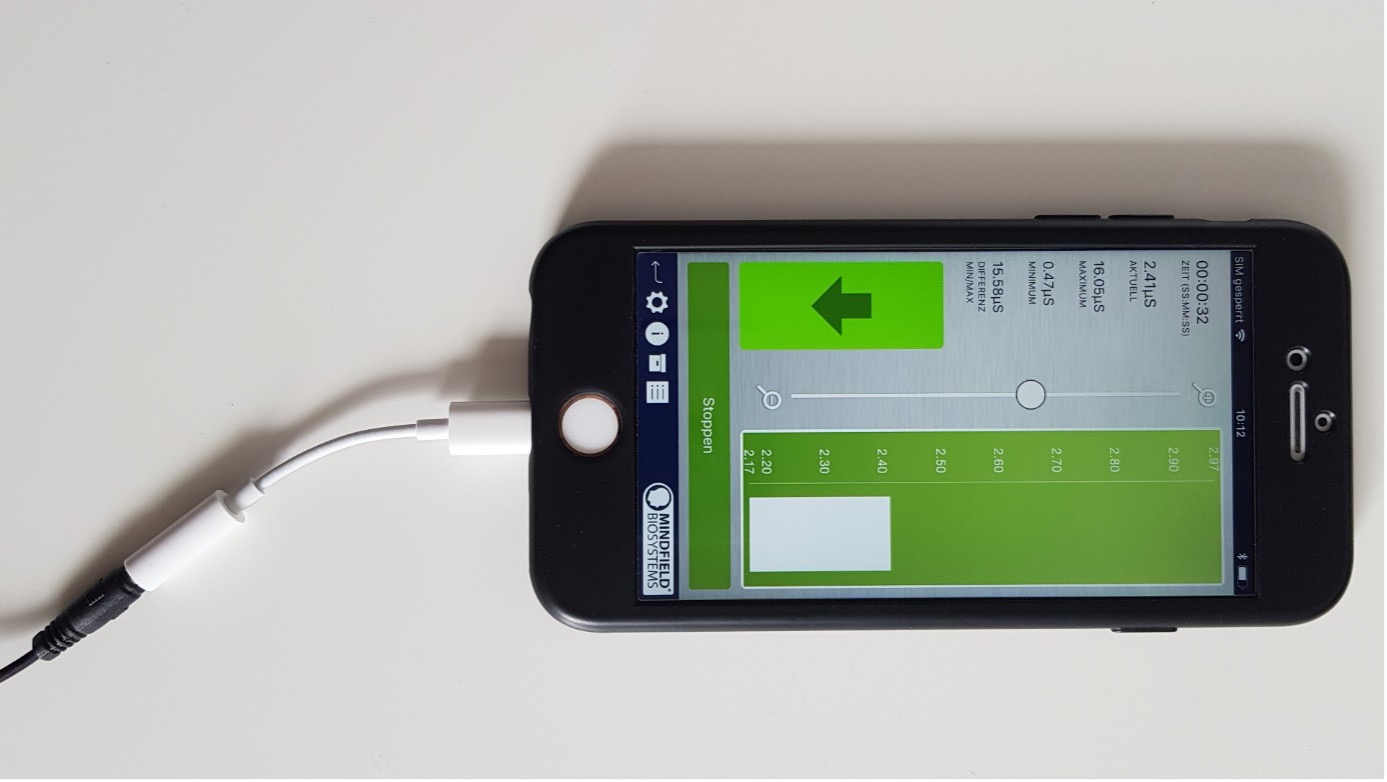 which no longer has a 3.5mm headphone jack, e.g. the iPhone X) Android devices that are compatible with the eSense
Important note about Android devices for the eSense Pulse: Important note about Android devices for the eSense Respiration, Skin Response and Temperature: Alternatively, you can use any other adapter with a DAC chip. We recommend this adapter on Amazon: https://amzn.to/2SnAUA1. Below are some Android devices that we have tested with the eSense Pulse, Respiration, Skin Response and Temperature and which work fine (whitelist). (Please note that this is only a very small sample and that the vast majority of devices worldwide work with the Mindfield eSense).
The following Android devices are NOT compatible with eSense Respiration, Skin Response and Temperature (blacklist). This list is not necessarily exhaustive. If you are not sure if your device is compatible, check if the microphone input is present as described above!
It is possible that these devices will work after all if you use the devices’ USB-C port instead. You can use a USB-C to 3.5 mm jack adapter for this purpose: https://amzn.to/2SnAUA1. 46. eSense Web App The eSense Web App is the browser-based dashboard for your eSense Mobile App. You reach it at https://esense.live and sign in with the same account you use in the app. The Web App complements the Mobile App with a larger screen on your computer, a searchable archive of all synchronized recordings, a CSV export for further analysis in Excel, and a real-time stream of your ongoing measurements from your smartphone to the browser. Trainers, coaches and therapists can additionally request the Supervisor role, which lets them follow several clients live at the same time. RequirementsTo use the eSense Web App you need an eSense account with an active Basic Plan or Premium Plan. Account registration alone is not sufficient – the cloud synchronization that the Web App relies on is only enabled by one of these plans. For an overview of the plans and their differences, see our articles Account Comparison and Account and Cloud. Login & language switchOn https://esense.live you can sign in with your Google or Apple account, or register the classic way using your e-mail address and a password. We recommend signing in with Google or Apple because it works without a separate password and behaves identically across all your devices. 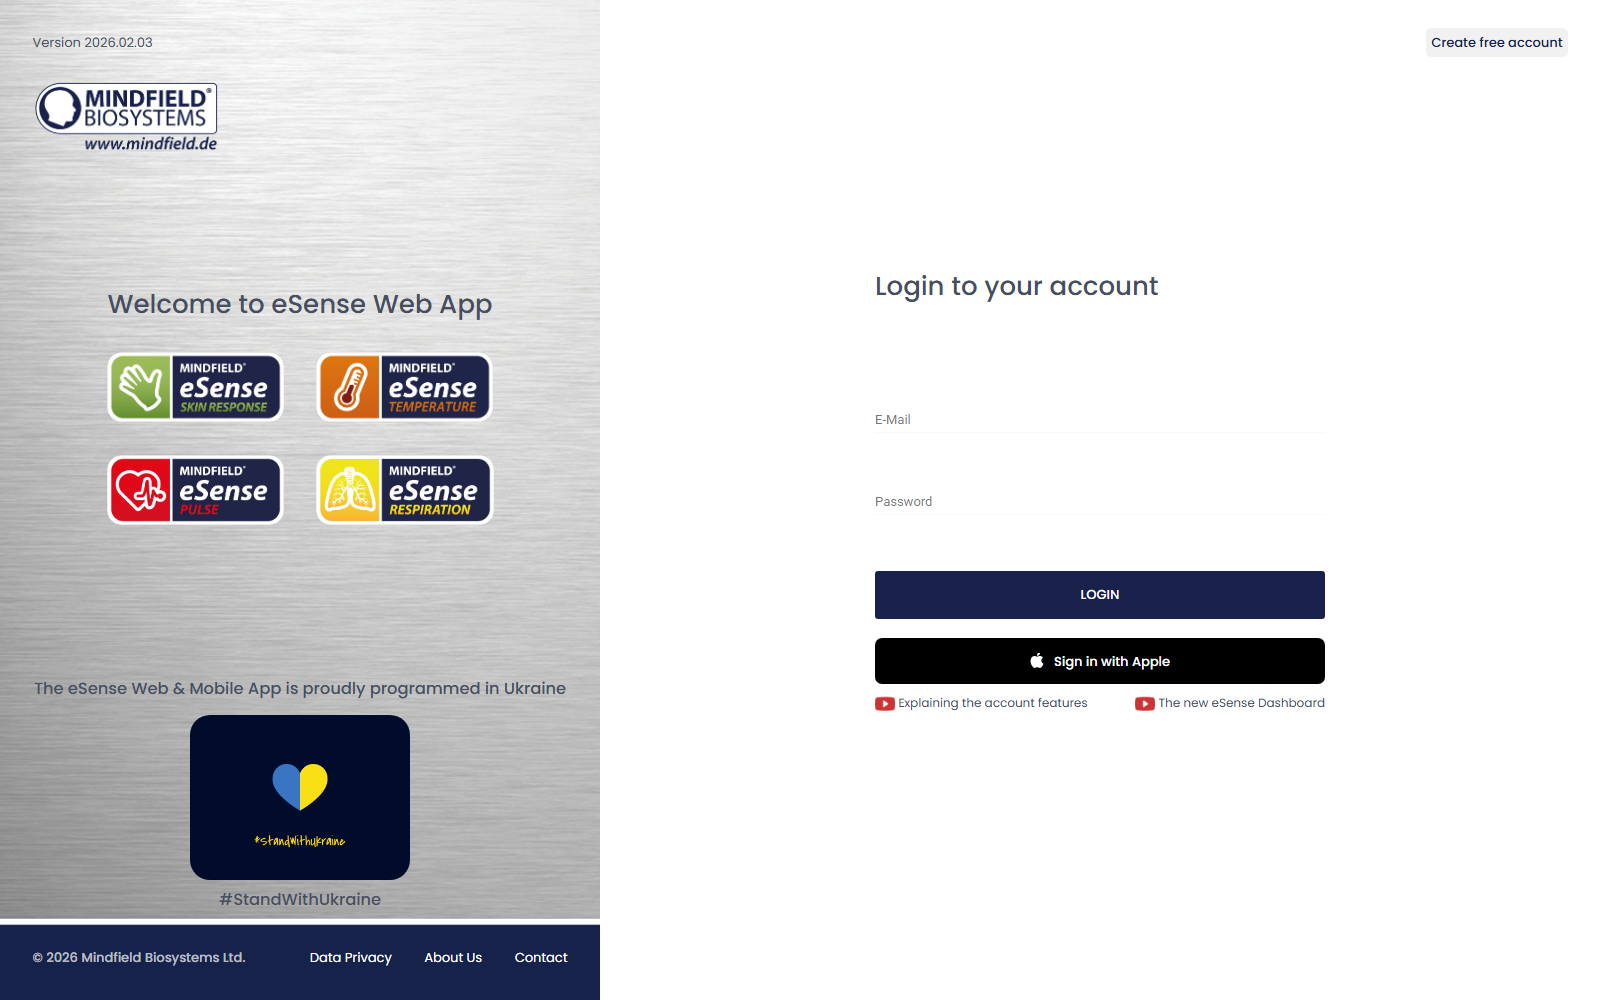 You can switch the interface language between German and English at any time using the flag icon in the top right corner. 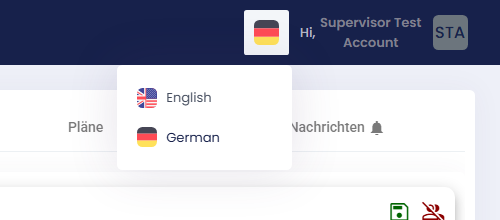 Profile pageAfter login you land on your personal profile page. It shows your master data, your role (such as User or Supervisor), the number of recordings you have made so far and the total number of days you have used the app. 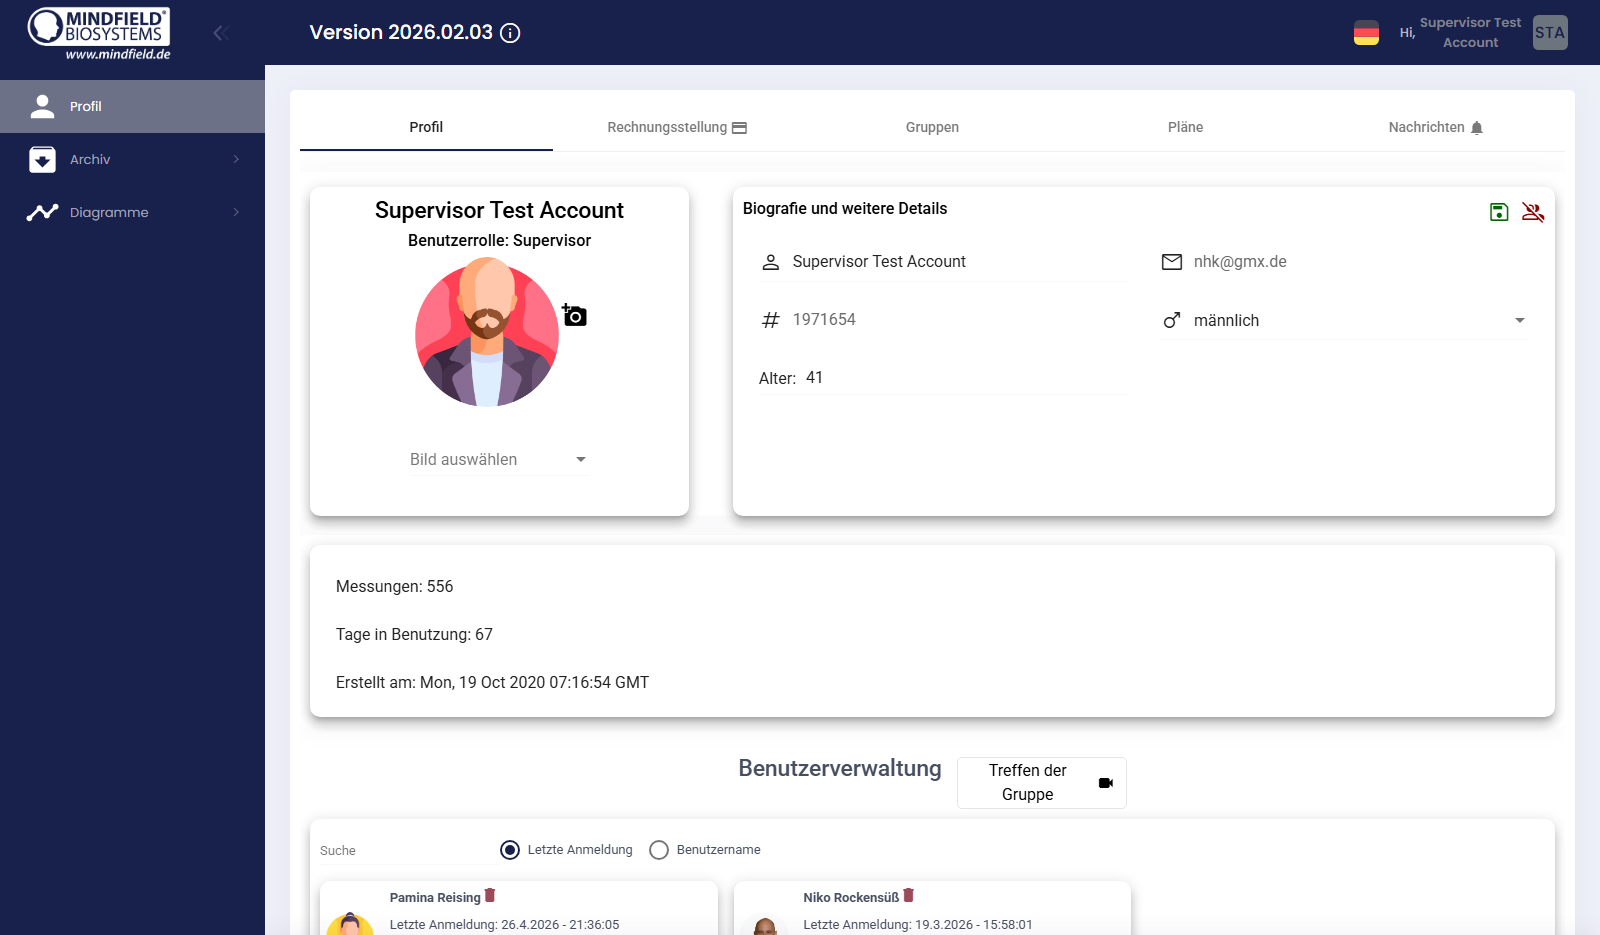 The top of the profile page shows five tabs that let you switch between the different profile areas:
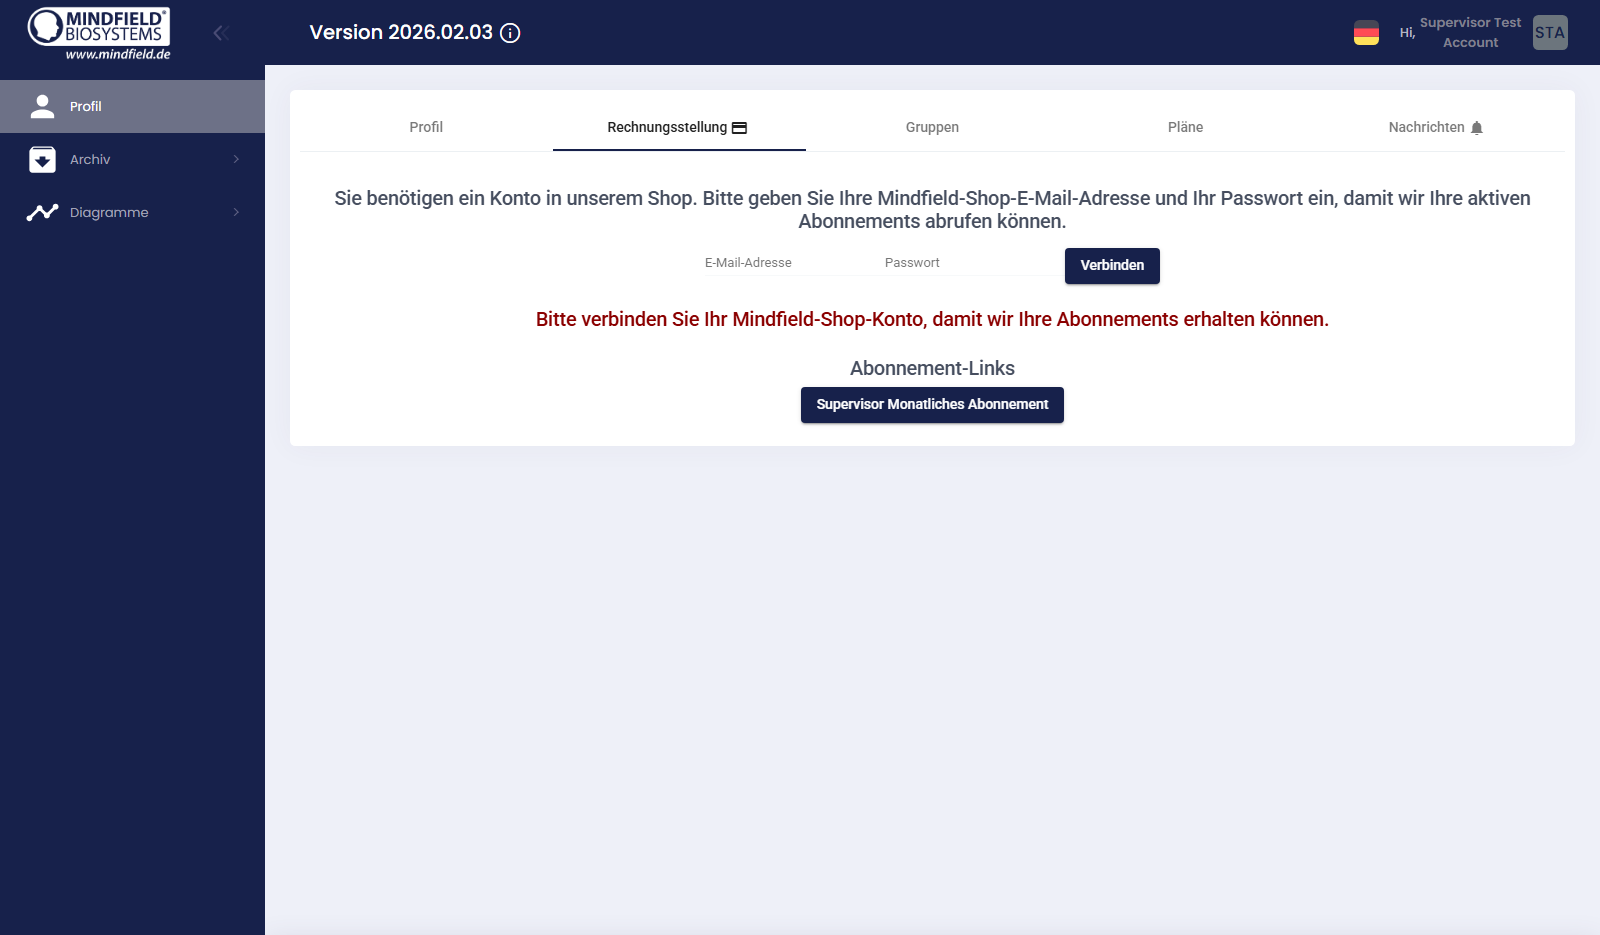  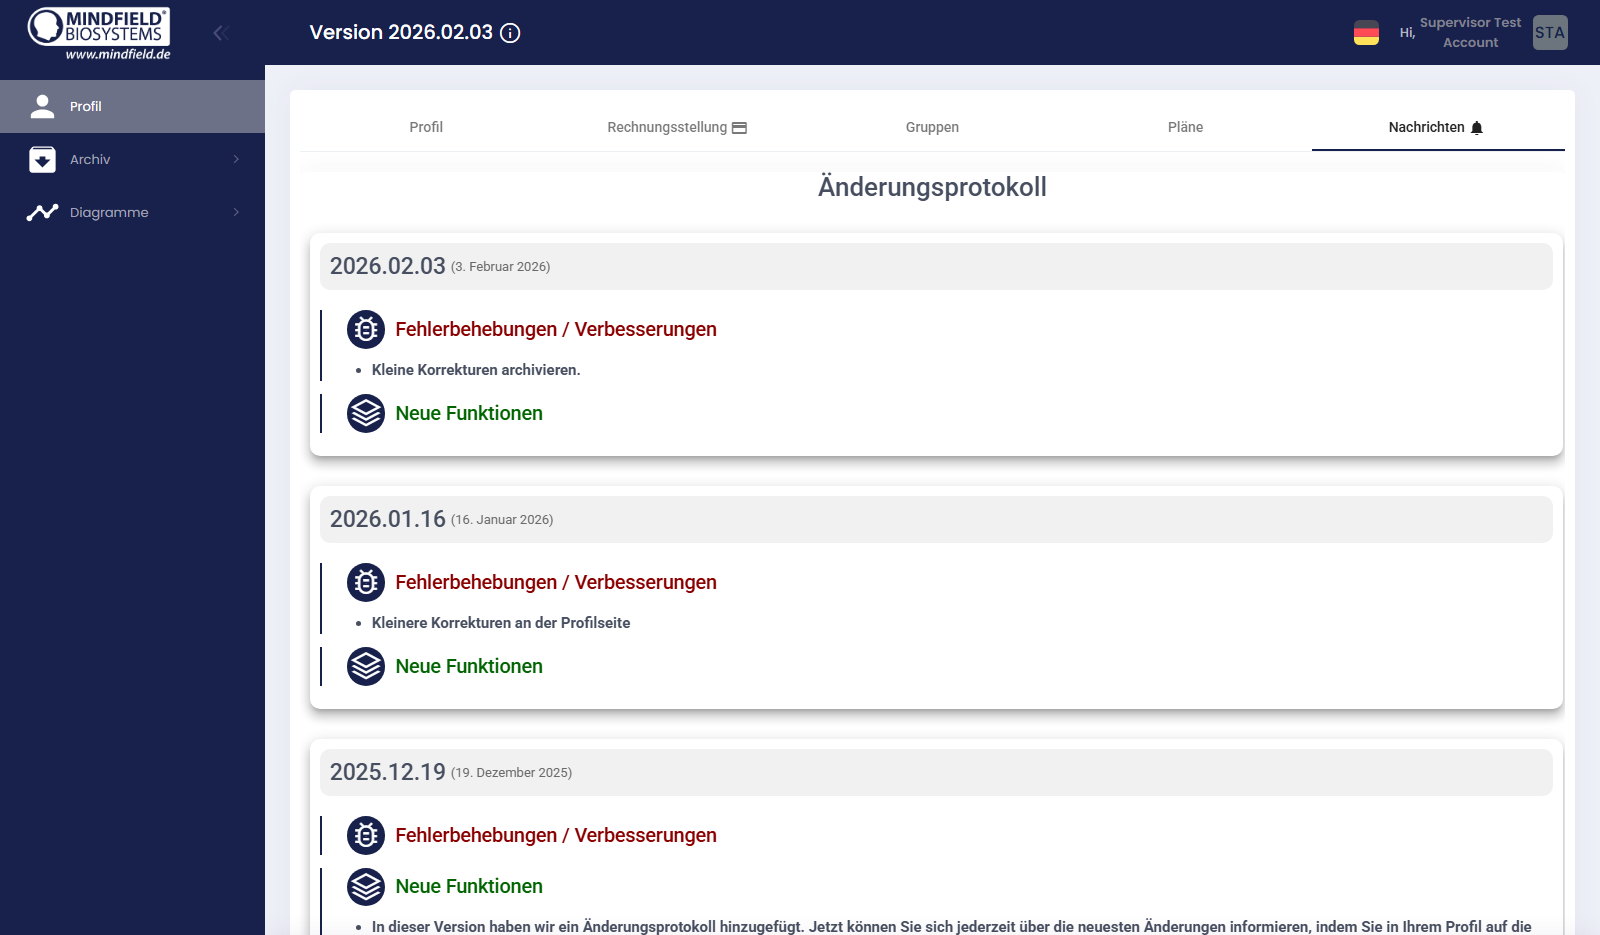 My ArchiveUnder Archive → My Archive you find all recordings that have been synchronized with your account. You can filter by sensor, open individual recordings, compare several sessions and download the data as a CSV file. 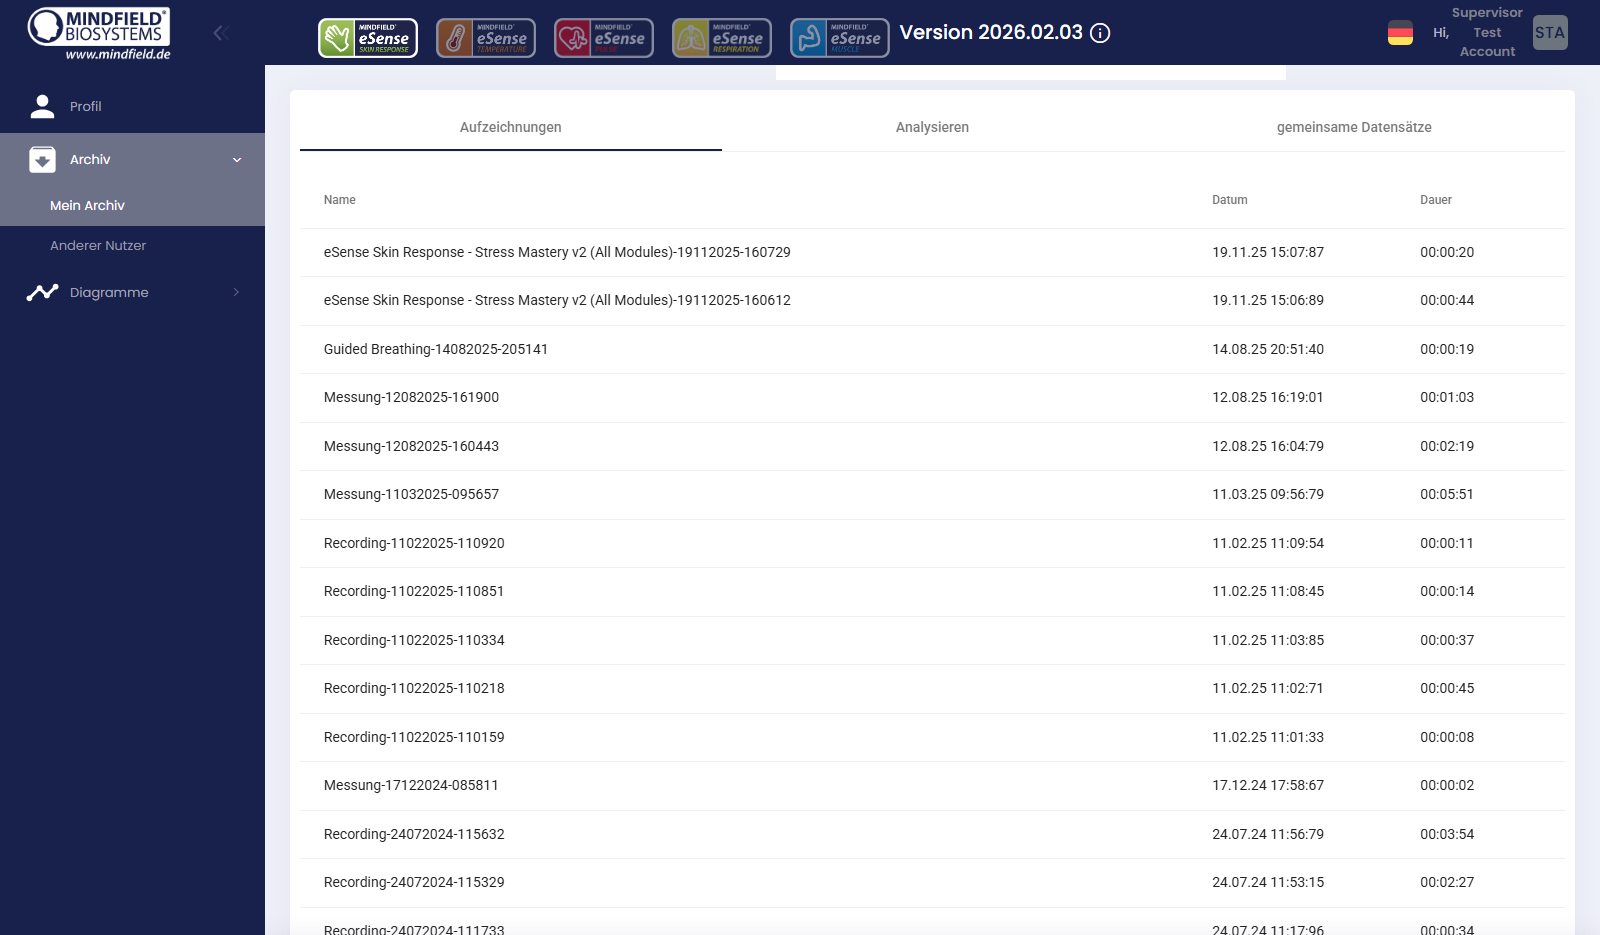 Clicking on a single recording opens a detailed analysis with numerical statistics, the curve over time and distribution charts. 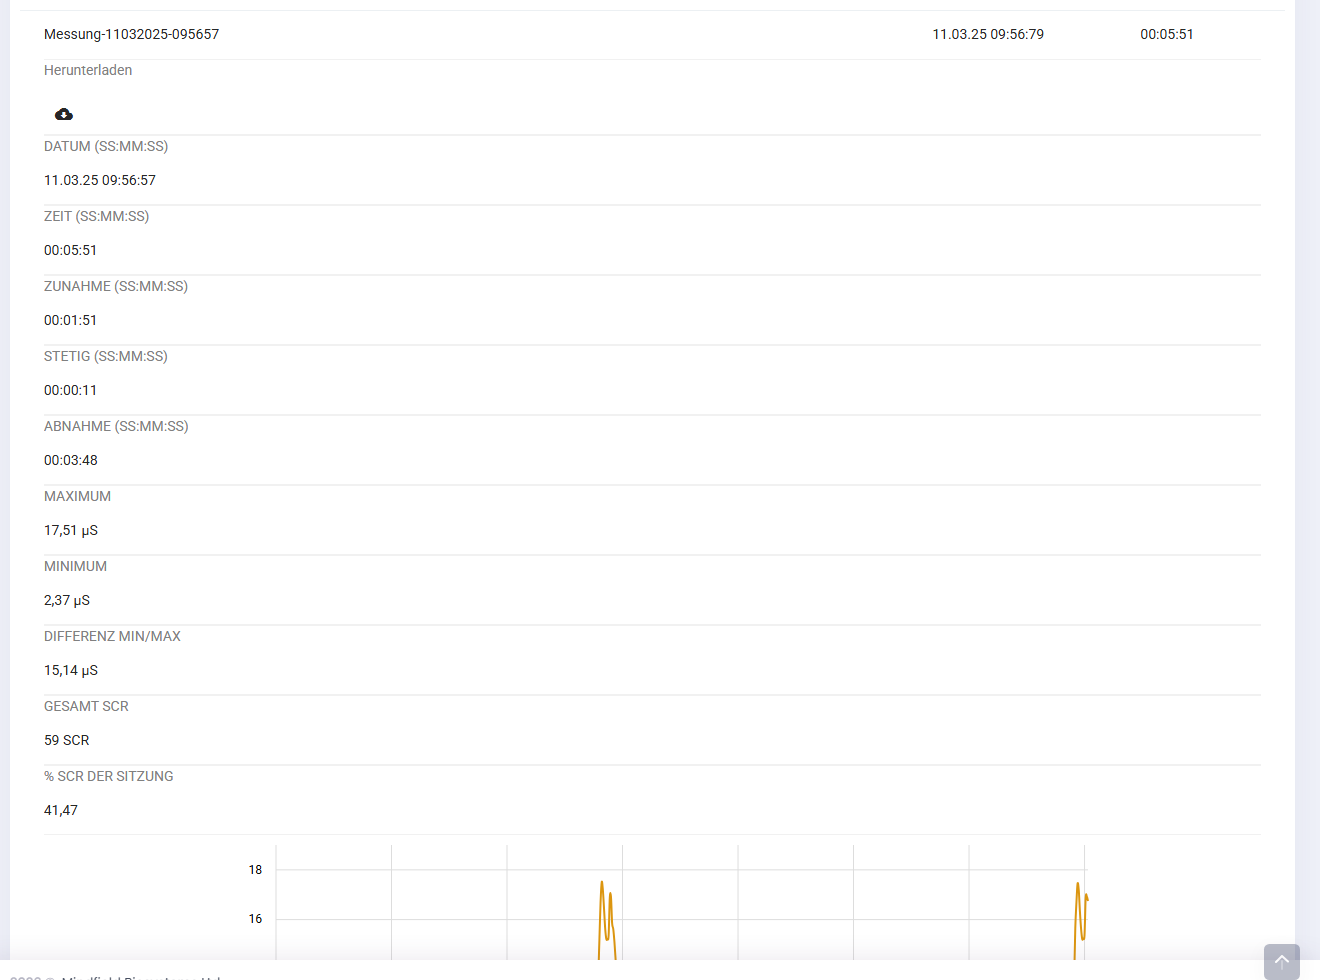 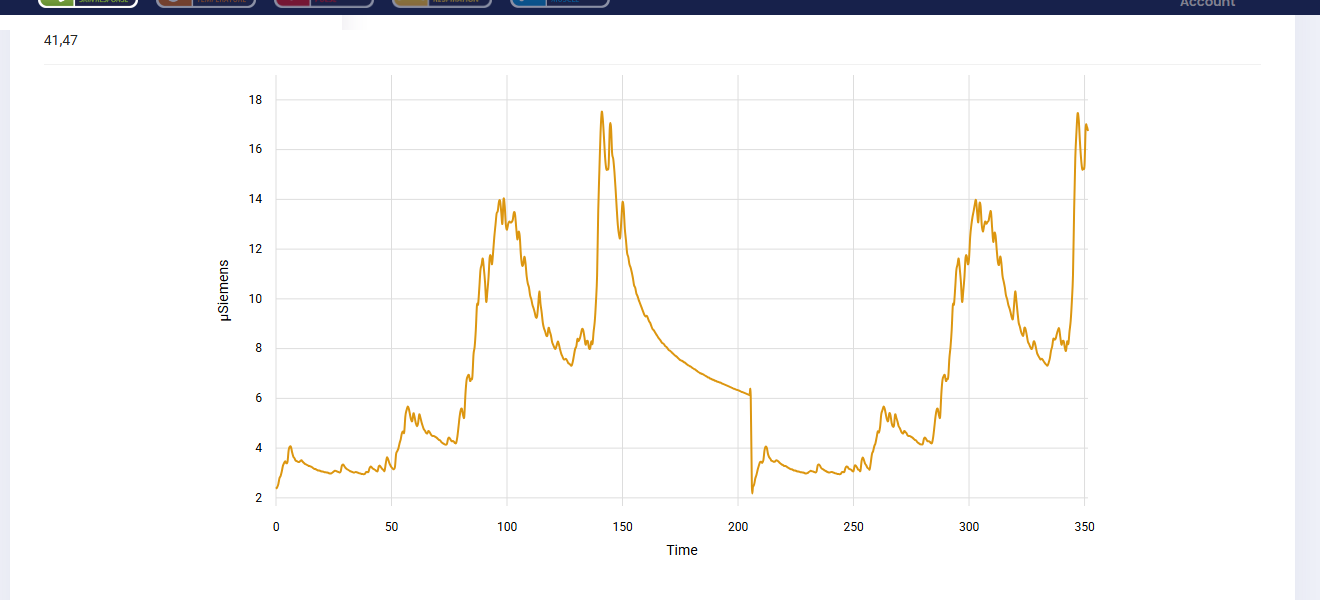 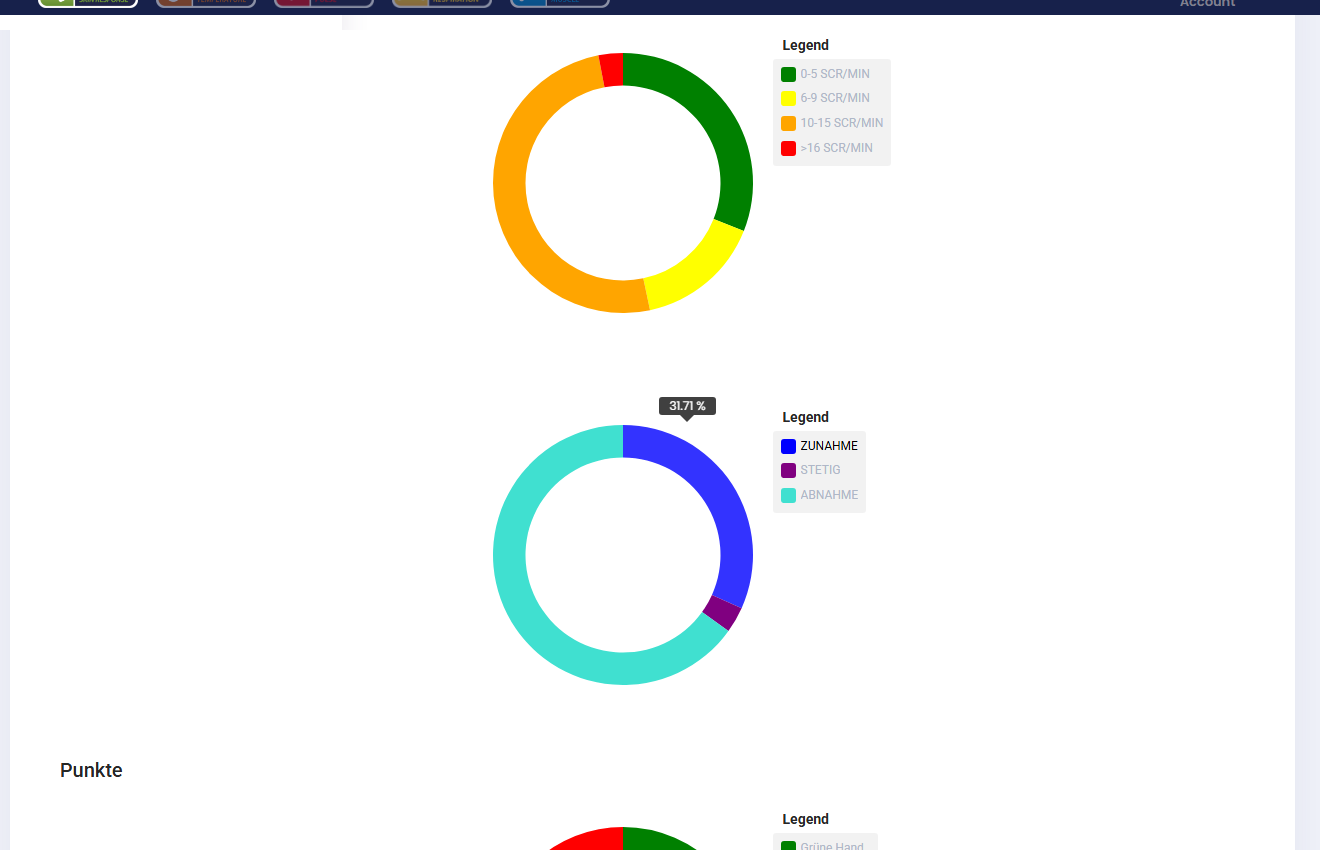 CSV exportThe Download button on the detail view of a recording lets you save the raw data of the session as a CSV file. The format is well suited for further processing in Excel or other spreadsheet and statistics tools. 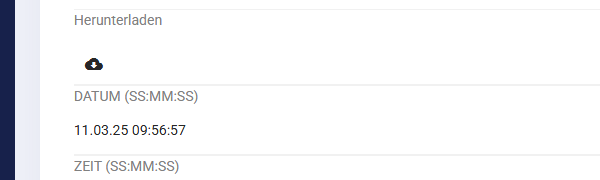 Note for users of the German version of Excel: the CSV file uses the English period as the decimal separator. A step-by-step guide for the correct column splitting can be found in our article Analysis of eSense data (CSV). A short answer to the export procedure is also available in FAQ: How can I export the measurements? Switching between eSense sensorsThe five sensor logos at the top of the Web App let you switch between the analyses of the different eSense sensors – Skin Response, Temperature, Pulse, Respiration and Muscle. Each sensor shows its own recordings, curves and statistics in the same detail view.  Live View (Premium)With the Premium Plan you can stream a running measurement from the Mobile App to the Web App in real time. To activate this, open the eSense app and go to Settings → Real-time data transfer to eSense Web App, then start a measurement. In the browser you immediately see the live curve together with minimum, maximum, current and average values.   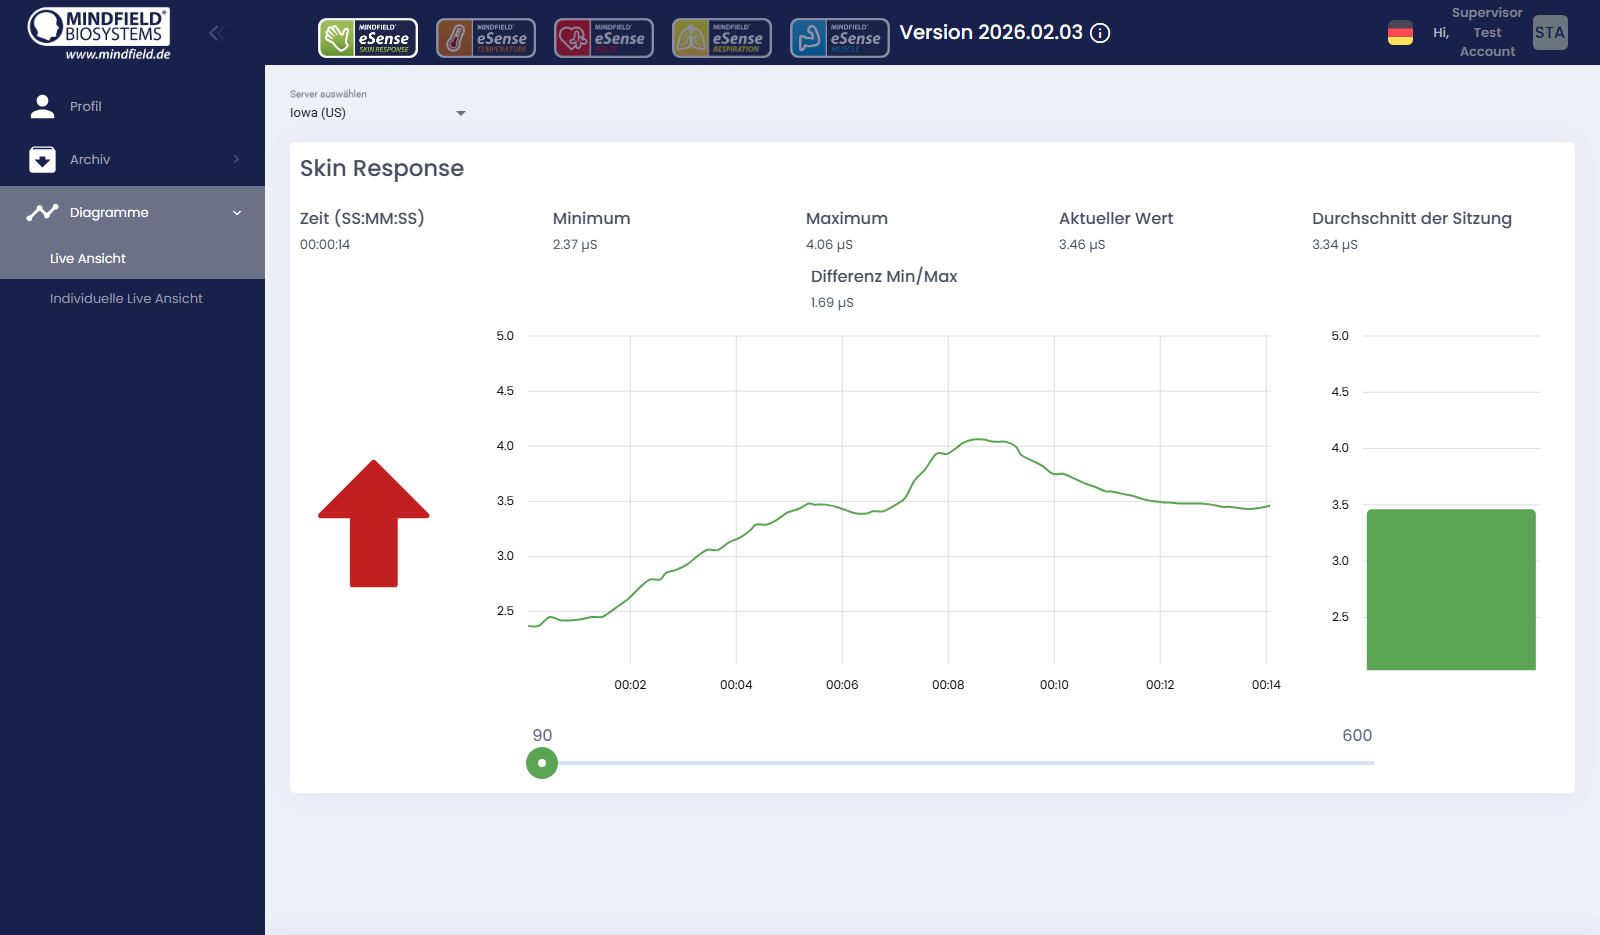 Custom Live ViewUnder Charts → Custom Live View you can build your own live view. Pick the sensor type and one or more users, then arrange the live tiles in a layout that suits your workflow. The custom layout can be saved and reloaded next time. 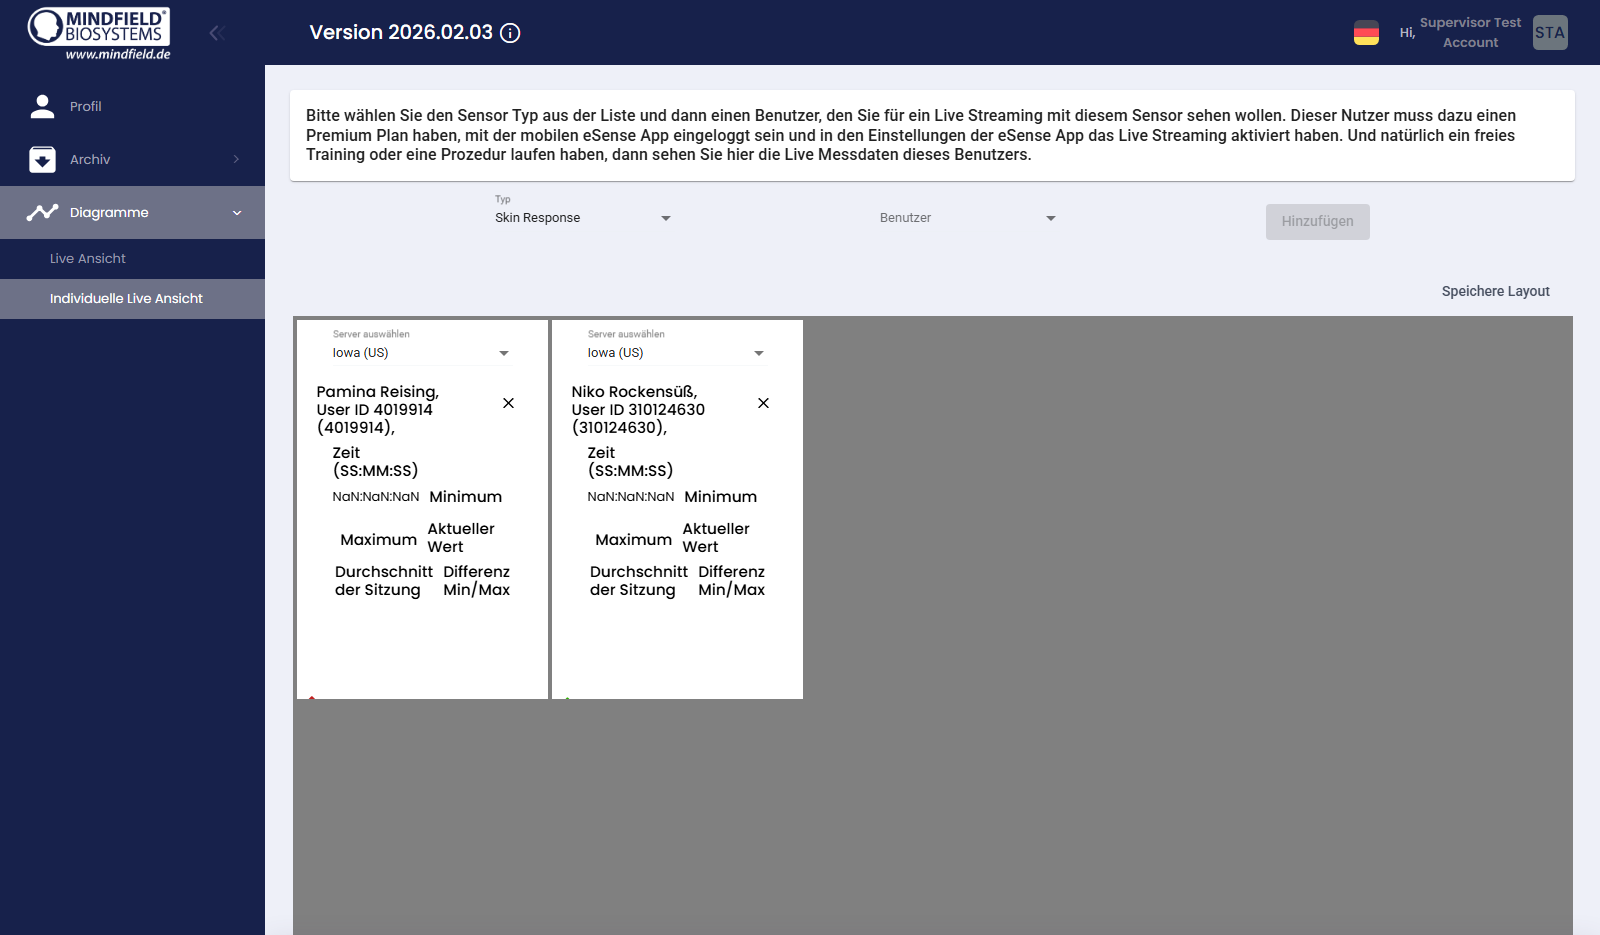 Shared RecordsIf another user shares a recording with you, it appears in the Shared Records tab inside „My Archive“. This way training progress can be exchanged transparently between client and trainer without having to share login credentials. 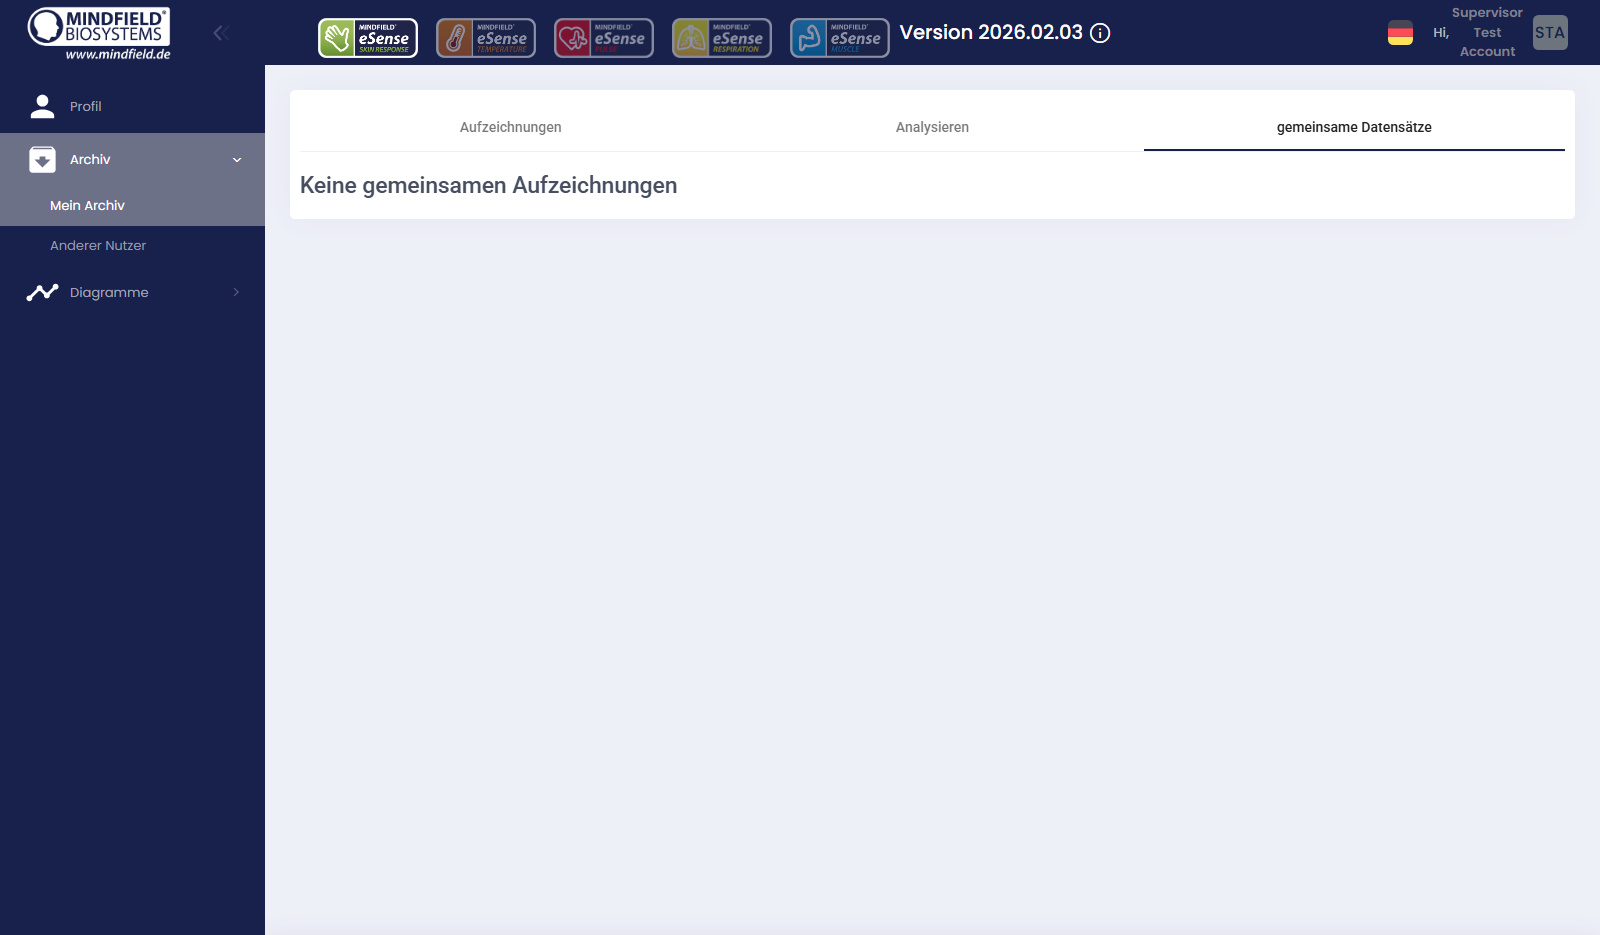 Supervisor featuresTrainers, coaches and therapists can request the Supervisor role on demand. With it, several clients can be supervised live at the same time – both in the real-time view of running measurements and in the archive of completed sessions. 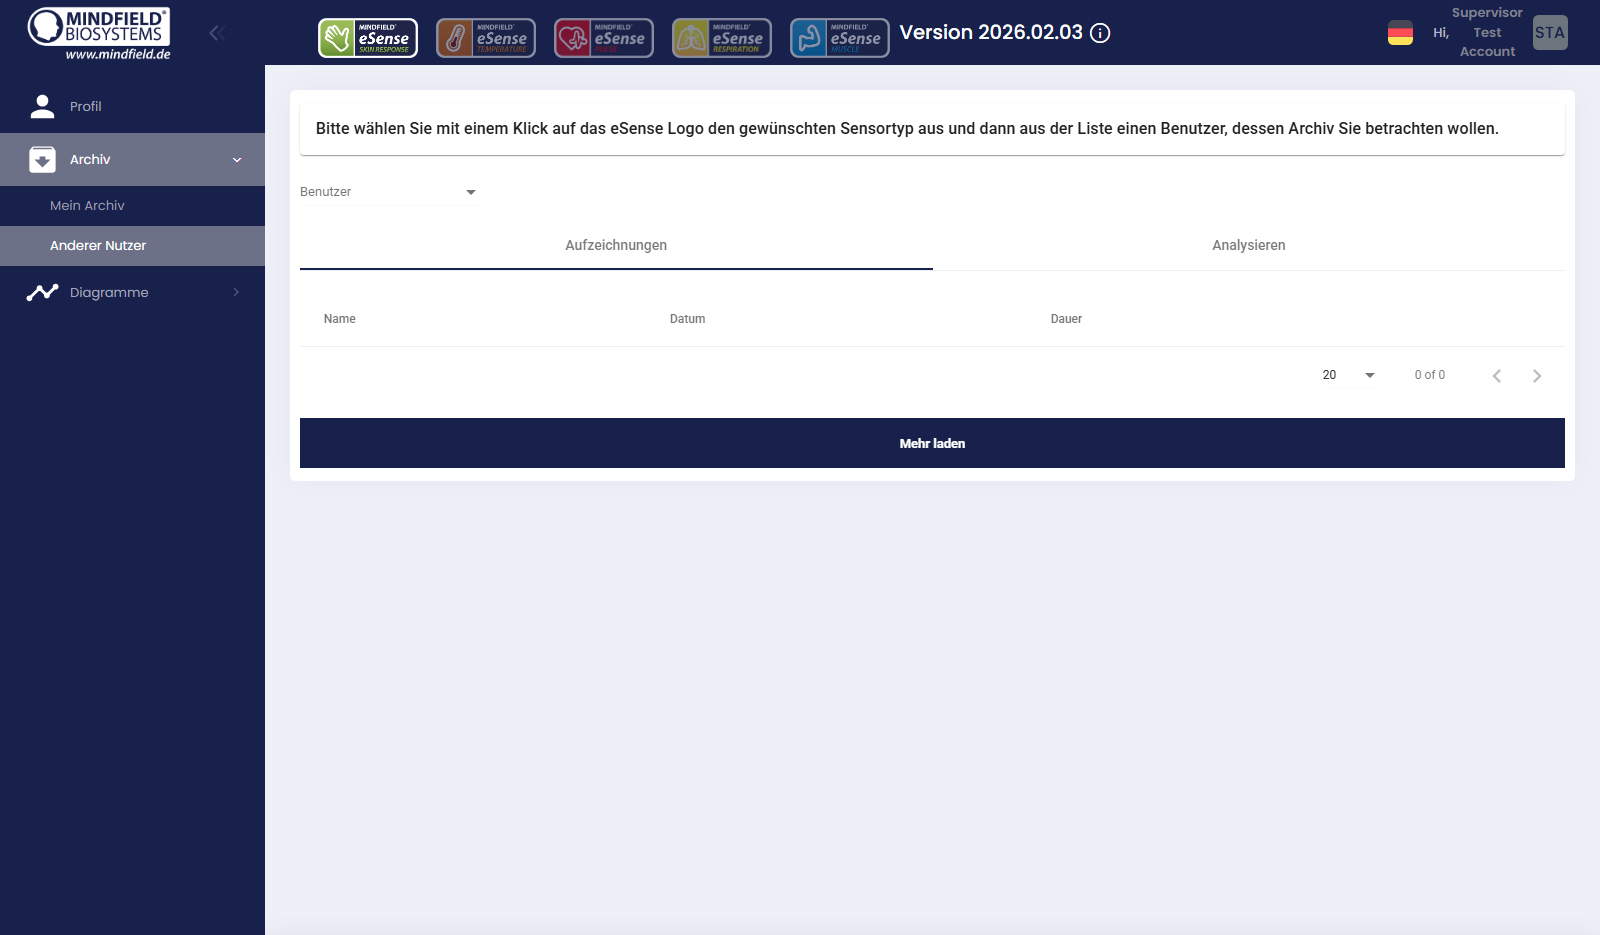 Important data protection note: Supervision is only possible after explicit authorization by the user concerned. Each user has to actively allow a Supervisor in their own profile to access their measurement or live data. Without this approval no access is possible. A detailed manual for Supervisors is available in our Supervisor Guide. Further reading
The eSense App and the eSense Web App work with all our eSense sensors – with the exception of the eSense EEGenius, which is analyzed via its own dedicated software. 47. Supervisor GuideSubscribe to a planYou must have activated a plan. You can book this in our mobile app (on Android and iOS), under Profile -> Plans. For sharing your measurments with a supervisor as client, the Basic Plan is sufficient (because the measurements are already uploaded to the cloud, so your supervisor can access your uploaded measurements). We also have an overview of different trainer-client scenarios here: https://mindfield.de/esense-app-fur-den-professionellen-anwender/ For the live streaming and custom live view, the client needs to have the Premium plan activated. 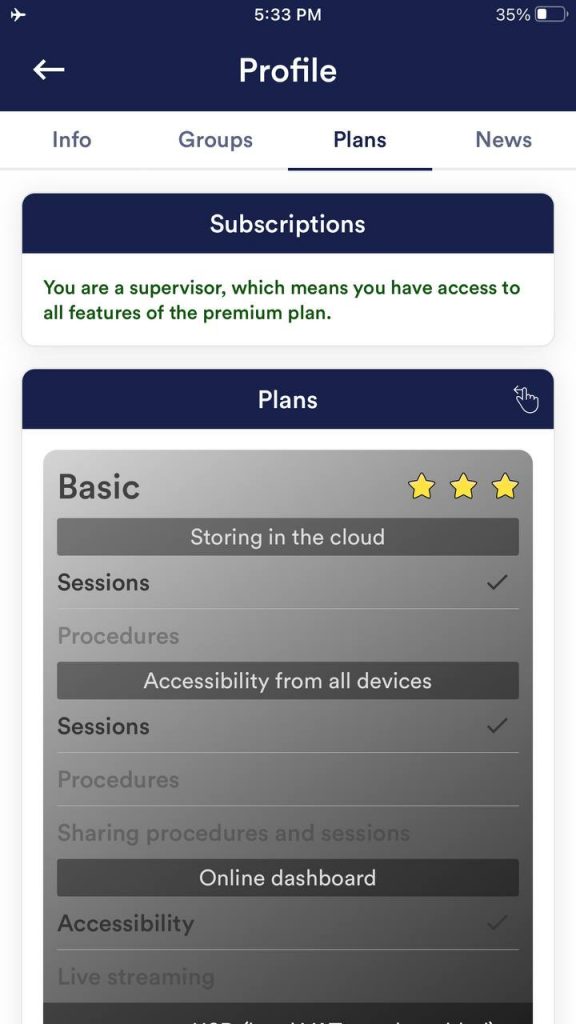 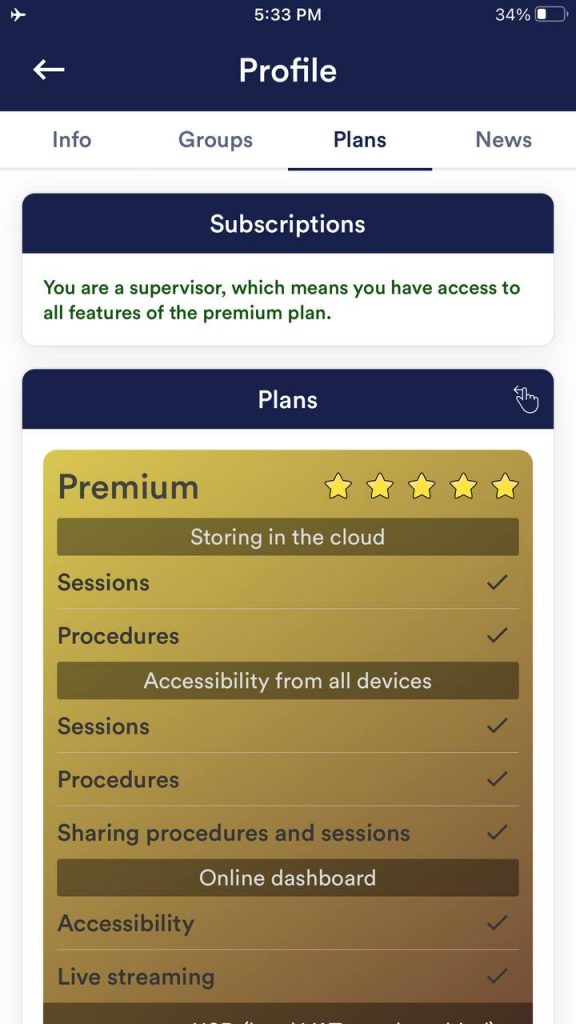 Client sideNext you need to login to our Web App at https://esense.live/ 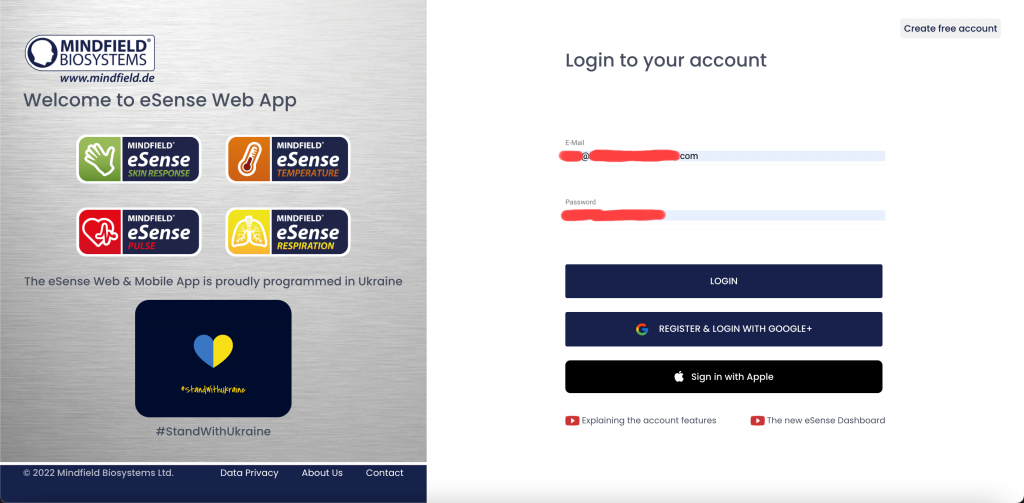 In order to share your measurements with a supervisor you need to have the Basic plan activated (as described in the first step above) 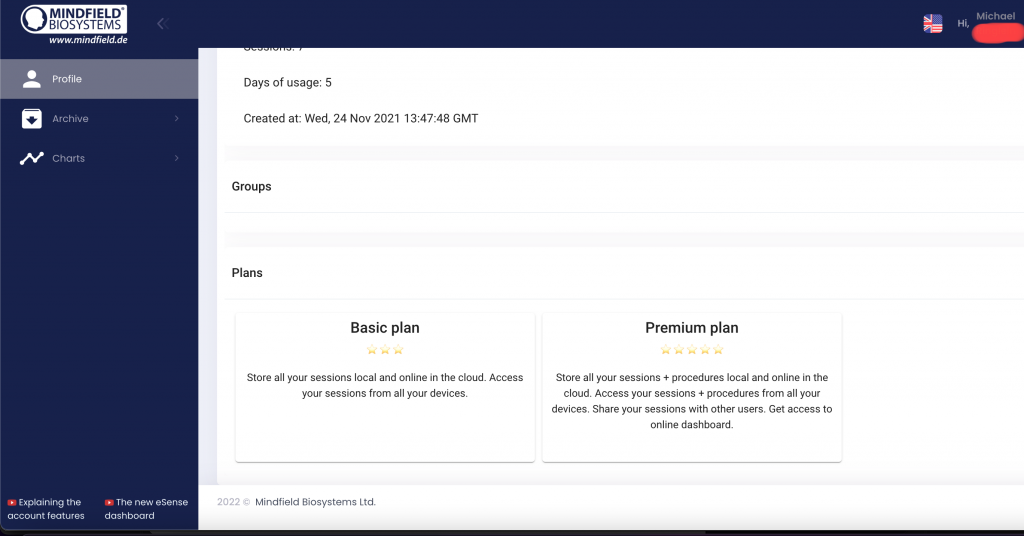 In the web app, you must enter the ID of your supervisor (with whom you want to share your measurements). For data protection reasons, this is unfortunately only possible in this way. This means that your desired supervisor must provide you with the ID and you must enter it in the following place and thus allow the supervisor access:  (For privacy reasons, supervisor mediators are now shown with their initials only. The e-mail is no longer displayed, only the ID). Trainer sideFirst you need to login to our Web App at https://esense.live/ You must be a registered Supervisor. You can buy the Supervisor Plan here:  In order to work with your client(s), the client(s) needs to
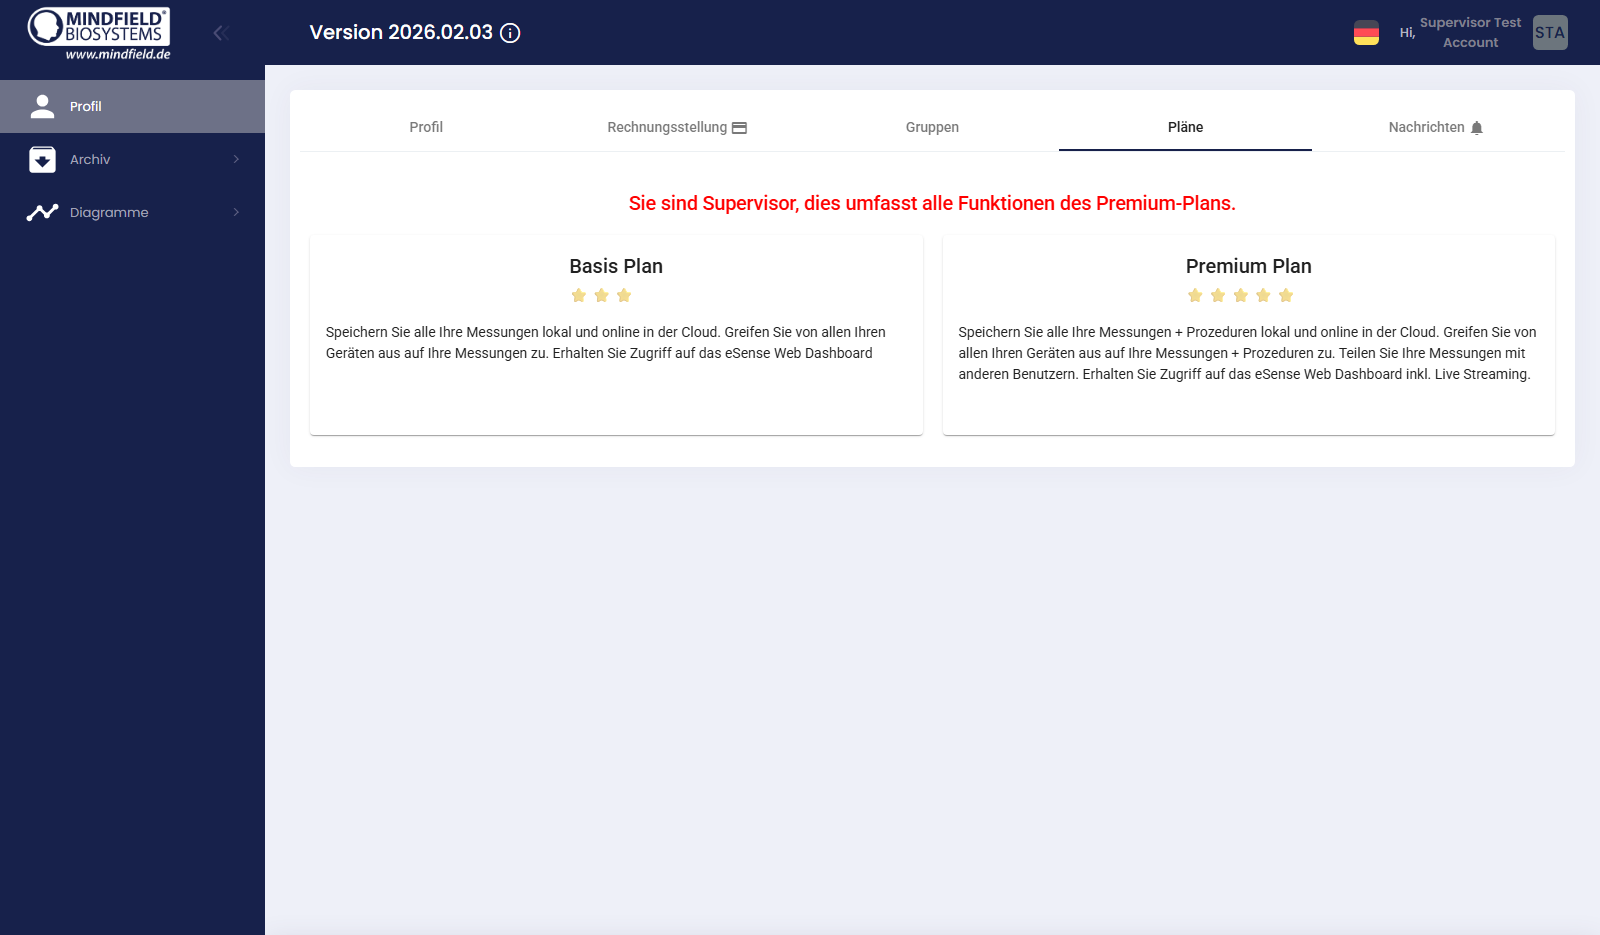
If you want to use the live streaming together with clients, the clients also need a stable internet connection. You can add clients by selecting them from the drop-down list. As the clients have previously explicitly granted you access, you should see your clients in the drop-down list.  ArchiveAs Supervisor you can see, analysis and compare saved measurements of your clients. Click on “Archive” -> “Other user” in the menu. Type in the email address of the client whose measurements you want to load and click on the “Search for id/email” Button 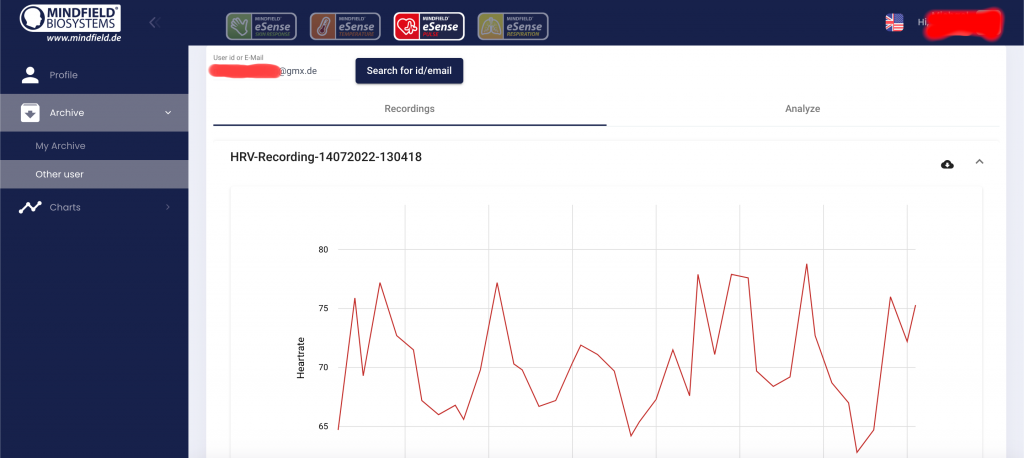 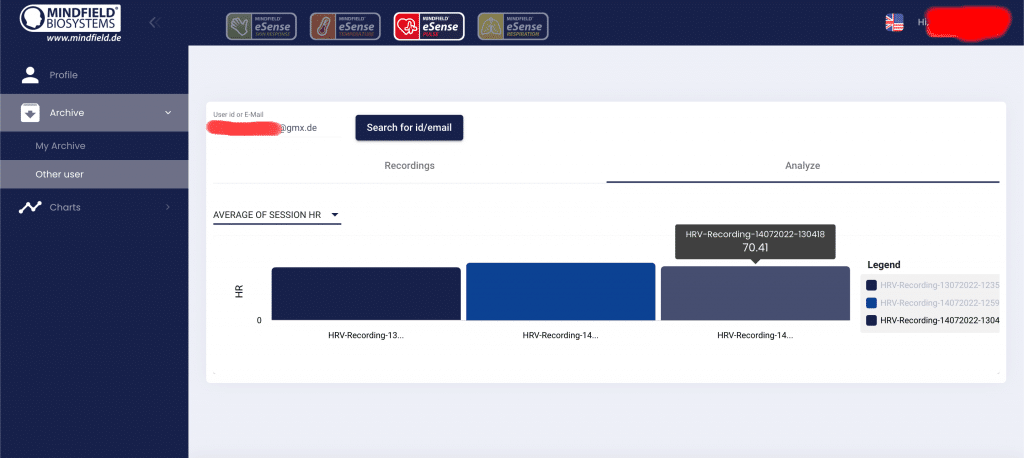 Deleting data in the archive (Archive Wipe)Since version 8.0.6 of the eSense App, measurement data can be deleted selectively directly in the app. This is particularly helpful for shared devices and multi-user scenarios. There are two ways: 1. Reset by the supervisor (from the Profile page)As a supervisor, you can reset the data of a client you supervise. To do so, open the Profile page of the relevant client in the eSense App and select the function to reset the data there. For security reasons, this function is protected and only available for the clients you supervise yourself. 2. Deletion per sensor by the user (three-dot menu in the archive)Each user can additionally delete their own data per sensor. Open the archive in the eSense App, tap the three-dot menu and select the deletion for the desired sensor. Important: Deletion removes the affected measurements both locally on the device and in the cloud. This process is irreversible and cannot be undone. Before deleting, check whether you still need the data or would like to export it beforehand. Activate streaming to esense.live in the eSense mobile appIf you are a supervisor, you can activate real-time data transmission to eSense Web App (esense.live) in the eSense app settings. Custom Live View (Live Streaming)For the custom live view and live streaming, you need to have the Premium Plan activated (as described in the first step above). Klick on “Charts” -> “Custom live view” in the menu. Select the client from the drop-down menu, select the Sensor at “Type” and click on “Add custom Chart”.  You can do this with several different sensors from the same user as well as see the measurements from several users at the same time. You could for example stream the Skin Response and Pulse from one client when the client does a combined measurement with the Skin Response and Pulse. But you also could have 2 or more clients all using an eSense Pulse at the same time and stream them next to each other (f.i. in a group session that you do online with several clients in different places) 48. Account and CloudYou can register your own, free account for the eSense app and book plans. You can also benefit from free, regularly added procedures without booking a plan. Thus, we recommend using the app with an account. With the plans you can mainly use the cloud and its functions and get also access to the eSense web app at https://esense.live. With the Basic Plan, you can save your measurements locally and online in the cloud and thus access your measurements from all devices and from anywhere. You also get access to the eSense web app. The Premium Plan includes all functions of the Basis Plan. In addition to your measurements, you can also save your custom procedures online in the cloud and thus access your procedures from all devices. (Attention: Technical limitations from Apple unfortunately do not allow the upload (and thus the synchronization) of audio files. The synchronization of picture and video files is possible, however). You can buy the Premium Plan here: https://mindfield-shop.com/en/product/premium-plan-for-esense-app-for-all-esense-sensors-annually/ There is also the Supervisor Plan. As a professional or commercial biofeedback trainer, you can use it to create individual procedures for your clients and share them with them via the cloud. You can buy the Supervisor Plan here: https://mindfield-shop.com/en/product/esense-supervisor-account-monthly-subscription-for-esense-app-and-esense-live You can also share your measurements with other users. You also have the option of transferring your data to the eSense web app in real time. To do this, activate “Real-time data transfer to eSense Web App” at the bottom of the settings. These plans can be used, among other things, to design a trainer’s client’s workflow. You can find an overview of the account and the cloud in our account comparison article. You can book the plans in our app in the profile tab: Cloud synchronisation after loginSince version 8 you have more control over cloud synchronisation: after signing in, synchronisation is no longer forced. You decide for yourself when your data is synced with the cloud. Whether and which data is stored in the cloud depends on the plan you have booked (see above). 49. Account ComparisonNote: Scroll the table left or right on mobile devices
2) Sharing with other users or groups possible 3) Sharing with other users possible Example cases for the different accountsSUPERVISORThe professional or commercial biofeedback trainer has a SUPERVISOR account so that he can create individual procedures for his clients and share them with them via the cloud. They can also create different groups and add their clients to them individually. This allows them to monitor and analyze their clients’ measurements over a longer period of time. You can buy the Supervisor Plan here: https://mindfield-shop.com/en/product/esense-supervisor-account-monthly-subscription-for-esense-app-and-esense-live/ PREMIUM PLANThe client who wants to work with a (professional) trainer and have access to all functions has a PREMIUM PLAN. This allows the client to share their recordings (both free measurements and procedures) with the trainer and other users. They can also upload their own procedures to the cloud and have them analyzed or adapted by the SUPERVISOR (trainer). BASIS PLANThe client who wants to work with a (professional) trainer needs at least this account so that he can share his recordings with the trainer (SUPERVISOR). WITHOUT PLANAnyone who simply wants to get a taste of the app does not need to join a plan to test its functionality. Example cases for the synchronization of measurements between accounts with different plansWithout account, without plan (and offline)All measurements are saved locally on the device. There is no synchronization with the cloud as there is no associated account. Users can only access their measurements on the device on which they were carried out. You can find the measurements in the archive under the Recordings tab. With account, without planThe measurements are linked to the user’s account but are not synchronized with the cloud. All measurements that are linked to the user’s account are displayed in the archive. The measurements can only be accessed if the user is logged into the account on the device on which the measurements were taken. You can find the measurements in the archive under the Recordings tab. With account, with basic or premium planAll measurements are linked to the user’s account and are synchronized with the cloud. All synchronized measurements that are linked to the user’s account are displayed in the archive. To synchronize old measurements that were created on the device before a plan was purchased with the cloud, you can select the “Synchronize with the cloud” button in the “Local session, performed without account” tab in the archive. These measurements are then assigned to the other measurements and disappear from this tab. Activate streaming to esense.live in the eSense mobile appIf you are a supervisor, you can activate real-time data transmission to eSense Web App (esense.live) in the eSense app settings. 50. GroupsThe accounts enable you to create your own groups or to join other groups. This allows you to share your recordings with your friends. Or you can work with a trainer as a client since you can share your recordings with the trainer. 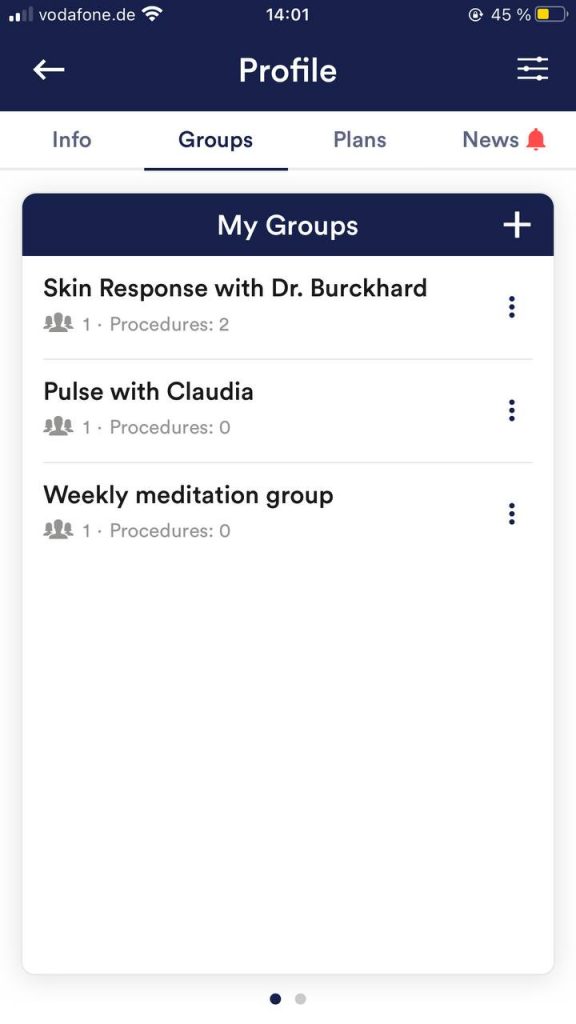 Create a group Tap on the plus symbol to create a group. Edit a group Tap on the 3 dots next to the group name You can then (if authorized) view and remove the members of the group or add new members. 51. Privacy policyThe eSense App does not collect any personal data, such as name, gender, date of birth, etc.. Each recording of measurement data is done under a general prefix such as “measurement”, supplemented by with the eSense sensor used, the current date and time of the measurement. The recorded measurement data cannot therefore be assigned to any person. The prefix of a recording, e.g. “measurement”, can be changed by the user in the settings and used for the assignment to a person. Users can decide whether to change this prefix to their name, for example. Then each measurement and also each CSV file exported from it contains the name of the user in the file name. Access rights within the eSense App
Transmission of anonymous usage data and crash reportsIn order to improve the technical stability of the eSense App and the detection of code errors, we use the Sentry service. Sentry serves these purposes alone and does not evaluate any data for advertising purposes. The transmission takes place anonymously and only with an existing internet connection. Processed data Usage data, metadata (device ID, device data, IP address). Special protective measures: IP masking, immediate deletion. External Functional Software Disclosure: Functional Software Inc., Sentry, 132 Hawthorne Street, San Francisco, California 94107, USA. Privacy Policy: https://sentry.io/privacy/. Processing in third countries: USA Warranty for processing in third countries: Privacy Shield, https://www.privacyshield.gov/participant?id=a2zt0000000TNDzAAO&status=Active. Deletion of the data: Information on the device or time of error is collected anonymously and is not used for personal purposes and then deleted. Medical information The Mindfield eSense sensors are not medical devices and may therefore only be used to reduce stress. If you suffer from an illness, do not carry out any treatment on your own and always consult a therapist. Warranty by the manufacturer The statutory warranty obligations apply to all our products. If you have any problems with our products, please contact us directly. See the “Contact” section of this manual. |
||||||||||||||||||||||||||||||||||||||||||||||||||||||||||||||||||||||||||||||||||