-
eSense Skin Response
-
- News
- Delivery contents Skin Response
- Technical Data
- All eSense in comparison
- Combination possibilities eSense sensors & Combined Feedback
- Example Measurements
- Analysis of eSense data (CSV)
- Streaming eSense data to a PC/Mac/Browser (eSense Web App, OSC)
- Duplicate eSense on a large screen (screen mirroring)
- Compatible Android and iOS devices
- Adapter for Android and Apple devices
- EC Declaration of Conformity
- Contact
-
- Functions of the Mindfield eSense App
- General notes
- Preparation and start of the app
- General view & Open Training
- Breath Pacer (optional)
- Biofeedback Snake
- Survey (optional)
- Pie charts (after a measurement)
- Procedure Overview
- Procedure editor
- Add new module
- Overview of the modules
- Creation of a procedure
- Meditations
- Own media (photos, videos and audios)
- Settings (Overview)
- In App Purchases
- Archive (overview)
- Archive (individual view)
- Marker feature
- Virtual Reality (VR) (f.i. Meta Quest 3)
- Compatible Android and iOS devices
- Adapter for Android and Apple devices
- Combination possibilities eSense sensors & Combined Feedback
- Privacy policy
-
- Can I also use (Bluetooth®-)speakers instead of headphones with the eSense?
- Can I change the language in the app?
- How can I export the measurements?
- How do I use my own audio or video?
- Is the app available in dark mode?
- My eSense does not work with iOS 9 (or higher).
- My eSense is not working
- My procedures are not synchronized correctly.
- My smartphone / tablet has no more 3.5mm jack input, which adapter do I need?
- The app still displays strongly fluctuating or senseless values. Touching or releasing the sensors of the Skin Response or the Temperature does not make a difference.
- The values for the eSense Skin Response are very small (below 1.0 µS). What can I do to improve the quality of measurement?
- What is the purpose of the accounts and the cloud in the eSense app? Do I need an account?
- Which App do I need and where can I download it?
- Which electrodes are working with the eSense?
-
-
eSense Temperature
-
- News
- Delivery contents eSense Temperature
- Technical Data
- All eSense in comparison
- Combination possibilities eSense sensors & Combined Feedback
- Example Measurements
- Analysis of eSense data (CSV)
- Streaming eSense data to a PC/Mac/Browser (eSense Web App, OSC)
- Duplicate eSense on a large screen (screen mirroring)
- Compatible Android and iOS devices
- Adapter for Android and Apple devices
- EC Declaration of Conformity
- Contact
-
- Functions of the Mindfield eSense App
- General notes
- Preparation and start of the app
- General view & Open Training
- Breath Pacer
- Biofeedback Snake
- Survey (optional)
- Pie charts (after a measurement)
- Procedure Overview
- Procedure editor
- Add new module
- Overview of the modules
- Creation of a procedure
- Meditations
- Own media (photos, videos and audios)
- Settings (Overview)
- In App Purchases
- Archive (overview)
- Archiv (individual view)
- Marker feature
- Virtual Reality (VR) (f.i. Meta Quest 3)
- Compatible Android and iOS devices
- Adapter for Android and Apple devices
- Combination possibilities eSense sensors & Combined Feedback
- Privacy policy
-
- Can I also use (Bluetooth®-)speakers instead of headphones with the eSense?
- Can I change the language in the app?
- How can I export the measurements?
- How do I use my own audio or video?
- Is the app available in dark mode?
- My eSense does not work with iOS 9 (or higher).
- My eSense is not working
- My procedures are not synchronized correctly.
- My smartphone / tablet has no more 3.5mm jack input, which adapter do I need?
- The app still displays strongly fluctuating or senseless values. Touching or releasing the sensors of the Skin Response or the Temperature does not make a difference.
- What is the purpose of the accounts and the cloud in the eSense app? Do I need an account?
- Which App do I need and where can I download it?
-
-
eSense Pulse
-
- News
- Delivery contents eSense Pulse
- Technical Data
- Example Measurements
- All eSense in comparison
- Comparison measurement eSense Pulse & Faros 180
- Combination possibilities eSense sensors & Combined Feedback
- Analysis of eSense data (CSV)
- Streaming eSense data to a PC/Mac/Browser (eSense Web App, OSC)
- Duplicate eSense on a large screen (screen mirroring)
- eSense Pulse & Bittium Faros 180 Comparison
- Compatible Android and iOS devices
- Troubleshooting connection problems
- EC Declaration of Conformity
- Contact
-
- Functions of the Mindfield eSense App
- General notes
- Preparation and start of the app
- General view & Open Training
- Breath Pacer
- Biofeedback Snake
- Spectrogram
- Survey (optional)
- Pie chart (after the measurement)
- Procedure Overview
- Procedure editor
- Add new module
- Overview of the modules
- Creation of a procedure
- Meditations
- Own media (photos, videos and audios)
- General settings
- In App Purchases
- eSense Pulse Analysis
- Explanation of the individual measured values
- Archive (overview)
- Archive (single view)
- Marker feature
- Virtual Reality (VR) (f.i. Meta Quest 3)
- Combination possibilities eSense sensors & Combined Feedback
- Compatible Android and iOS devices
- Troubleshooting connection problems
- Privacy policy
-
- Can I also use (Bluetooth®-)speakers instead of headphones with the eSense?
- Can I change the language in the app?
- How can I export the measurements?
- How do I use my own audio or video?
- Is the app available in dark mode?
- My eSense does not work with iOS 9 (or higher).
- My eSense is not working
- My procedures are not synchronized correctly.
- The app doesn’t find the eSense Pulse
- What battery belongs in the eSense Pulse?
- What is the purpose of the accounts and the cloud in the eSense app? Do I need an account?
- Which App do I need and where can I download it?
- Why are some parameters (e.g. SDNN, RMSSD, pNN50) a bit different in the eSense app than in the Kubios software?
-
-
eSense Respiration
-
- News
- Delivery contents eSense Respiration
- Example Measurements
- All eSense in comparison
- Combination possibilities eSense sensors & Combined Feedback
- Analysis of eSense data (CSV)
- Streaming eSense data to a PC/Mac/Browser (eSense Web App, OSC)
- Duplicate eSense on a large screen (screen mirroring)
- Compatible Android and iOS devices
- Adapter for Android and Apple devices
- Cleaning and Care
- Troubleshooting Measuring Signal and Breathing Belt
- EC Declaration of Conformity
- Contact
-
- Functions of the Mindfield eSense App
- General notes
- Preparation and start of the app
- General view & Open Training
- Breath Pacer
- Biofeedback Snake
- Survey (optional)
- Pie Chart (after the measurement)
- Procedure Overview
- Procedure editor
- Add new module
- Overview of the modules
- Creation of a procedure
- Meditations
- Own media (photos, videos and audios)
- General settings
- In App Purchases
- Archive (overview)
- Archive (single view)
- Marker feature
- Virtual Reality (VR) (f.i. Meta Quest 3)
- Compatible Android and iOS devices
- Adapter for Android and Apple devices
- Explanation of the Individual Measured Values
- Combination possibilities eSense sensors & Combined Feedback
- Privacy policy
-
- Can I also use (Bluetooth®-)speakers instead of headphones with the eSense?
- Can I change the language in the app?
- How can I export the measurements?
- How do I use my own audio or video?
- I do not get any (reasonable) measured values, what can I do?
- Is the app available in dark mode?
- My eSense does not work with iOS 9 (or higher).
- My eSense is not working
- My procedures are not synchronized correctly.
- My smartphone / tablet has no more 3.5mm jack input, which adapter do I need?
- What is the purpose of the accounts and the cloud in the eSense app? Do I need an account?
- Which App do I need and where can I download it?
-
-
eSense Muscle
-
- News
- Delivery contents eSense Muscle
- Note Pro and Home version
- Note on the Apps
- Technical Data
- All eSense in comparison
- Analysis of eSense data (CSV)
- Streaming eSense data to a PC/Mac/Browser (eSense Web App, OSC)
- Duplicate eSense on a large screen (screen mirroring)
- Battery Information
- Compatible Android and iOS devices
- Troubleshooting connection problems
- EC Declaration of Conformity
- Contact
-
- Articles coming soon
-
- Note on the Apps
- Notes before starting the eSense Mobile App
- Preparation and start of the eSense Mobile App
- General notes
- General view & Open Training
- Contraction Helper
- Survey (optional)
- Analysis (after the measurement)
- Procedure Overview
- Procedure editor
- Add new module
- Overview of the modules
- Creation of a procedure
- Meditations
- Own media (photos, videos and audios)
- General settings
- In App Purchases
- Archive (overview)
- Archive (single view)
- Marker feature
- Virtual Reality (VR) (f.i. Meta Quest 3)
- Compatible Android and iOS devices
- Privacy policy
-
- Can I also use (Bluetooth®-)speakers instead of headphones with the eSense?
- Can I change the language in the app?
- How can I export the measurements?
- How do I use my own audio or video?
- Is the app available in dark mode?
- My eSense does not work with iOS 9 (or higher).
- My eSense is not working
- My procedures are not synchronized correctly.
- The app doesn’t find the eSense Muscle.
- What is the purpose of the accounts and the cloud in the eSense app? Do I need an account?
-
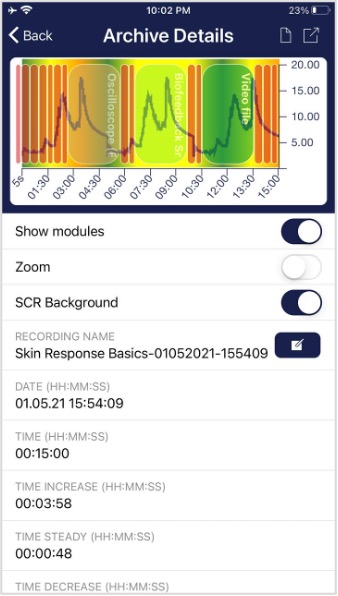
Archive (individual view)


Export data
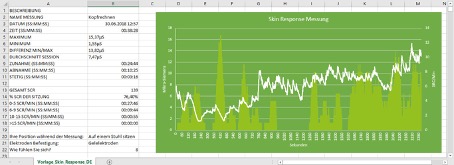
Thanks to our export functions at the bottom of a recording, you can export the recordings in PDF or .csv format with all common apps (e.g. send via Messenger, WhatsApp, e-mail, etc.) or simply save them on your phone or in your cloud.
The data are exported as a.csv-file (comma separated values). This format can be opened with Microsoft Excel or Open Office Calc (for free).
If you like to work with Google, Google Sheets can be an alternative to Excel for you. You can open your exported .csv-files, visualize and access them via the cloud easily from several devices. Google Sheets has almost the same functions and interface as Excel.
Note: We have also summarized more detailed information on CSV export and processing your data in an extra article on streaming and analyzing eSense data.

SRC
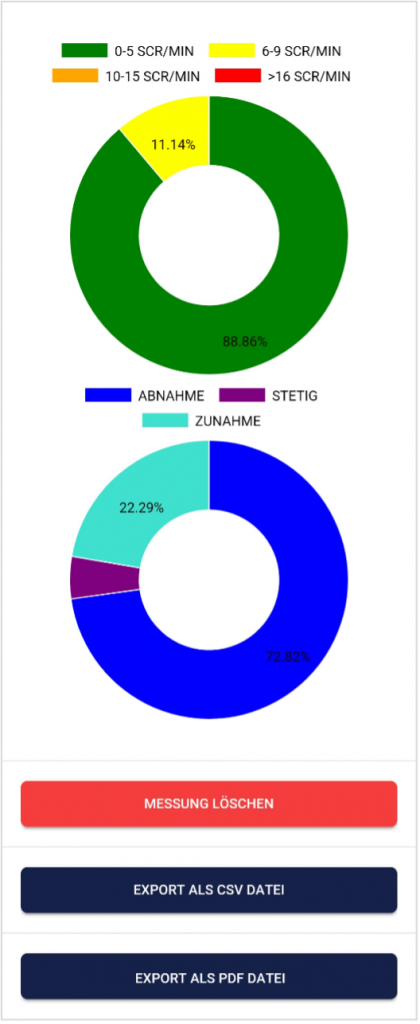
You can see the SRC of the measurement here as well. Both pie charts are the same as those that you see right after the measurement. You can find more information in the chapter about Skin Conductance Response (SCR) in this manual.
Parts of increase/decrease/steady
In the pie chart you can see the parts in which the measured values where increasing, decreasing or steady.
Export as PDF File
You can export the measurement also as PDF alternatively. Note: This takes a moment.

In Excel™ or Google Sheets™
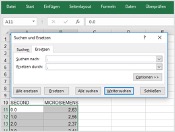
Notice: If you open the .csv-file with Excel™ (or Google Sheets™) and your values make no sense, then there is usually a different set language in the eSense App and Excel™ and Sheets™.
Note: We have also summarized more detailed information on CSV export and processing your data in an extra article on streaming and analyzing eSense data.

Questions