eSense Web App
The eSense Web App is the browser-based dashboard for your eSense Mobile App. You reach it at https://esense.live and sign in with the same account you use in the app. The Web App complements the Mobile App with a larger screen on your computer, a searchable archive of all synchronized recordings, a CSV export for further analysis in Excel, and a real-time stream of your ongoing measurements from your smartphone to the browser. Trainers, coaches and therapists can additionally request the Supervisor role, which lets them follow several clients live at the same time.
Requirements
To use the eSense Web App you need an eSense account with an active Basic Plan or Premium Plan. Account registration alone is not sufficient – the cloud synchronization that the Web App relies on is only enabled by one of these plans. For an overview of the plans and their differences, see our articles Account Comparison and Account and Cloud.
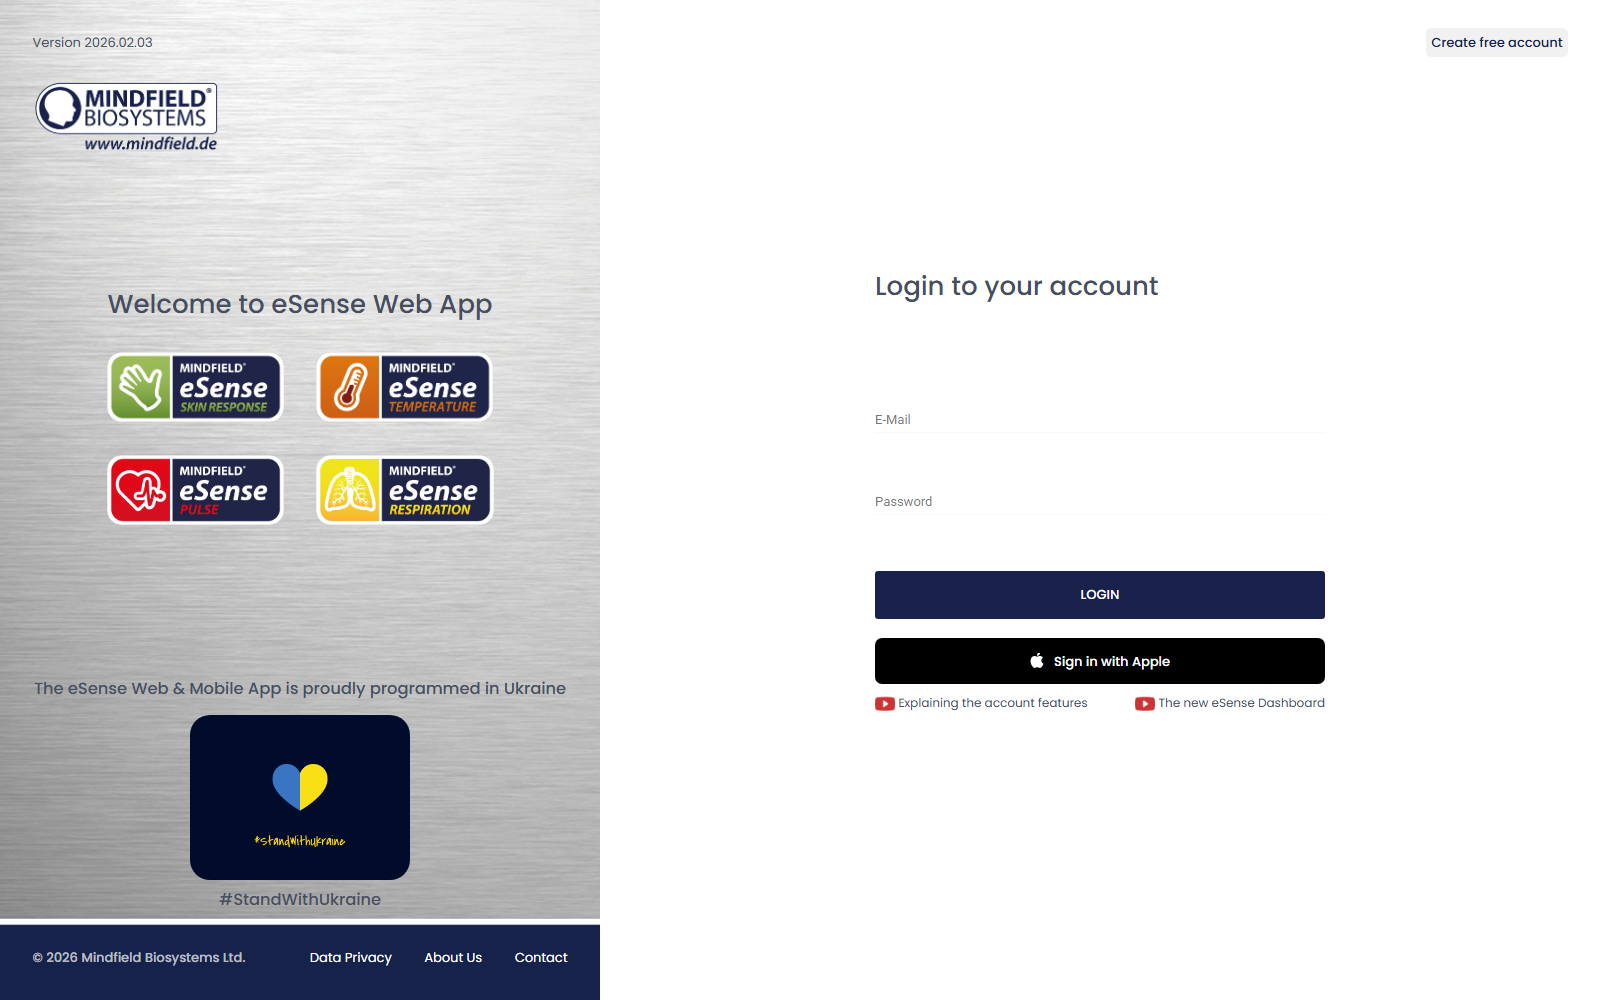
Login & language switch
On https://esense.live you can sign in with your Google or Apple account, or register the classic way using your e-mail address and a password. We recommend signing in with Google or Apple because it works without a separate password and behaves identically across all your devices.
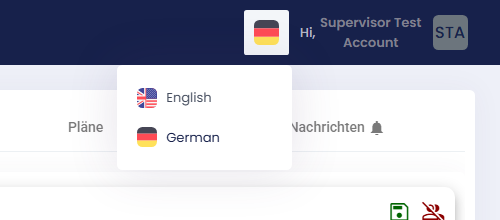
You can switch the interface language between German and English at any time using the flag icon in the top right corner.
Profile page
After login you land on your personal profile page. It shows your master data, your role (such as User or Supervisor), the number of recordings you have made so far and the total number of days you have used the app.
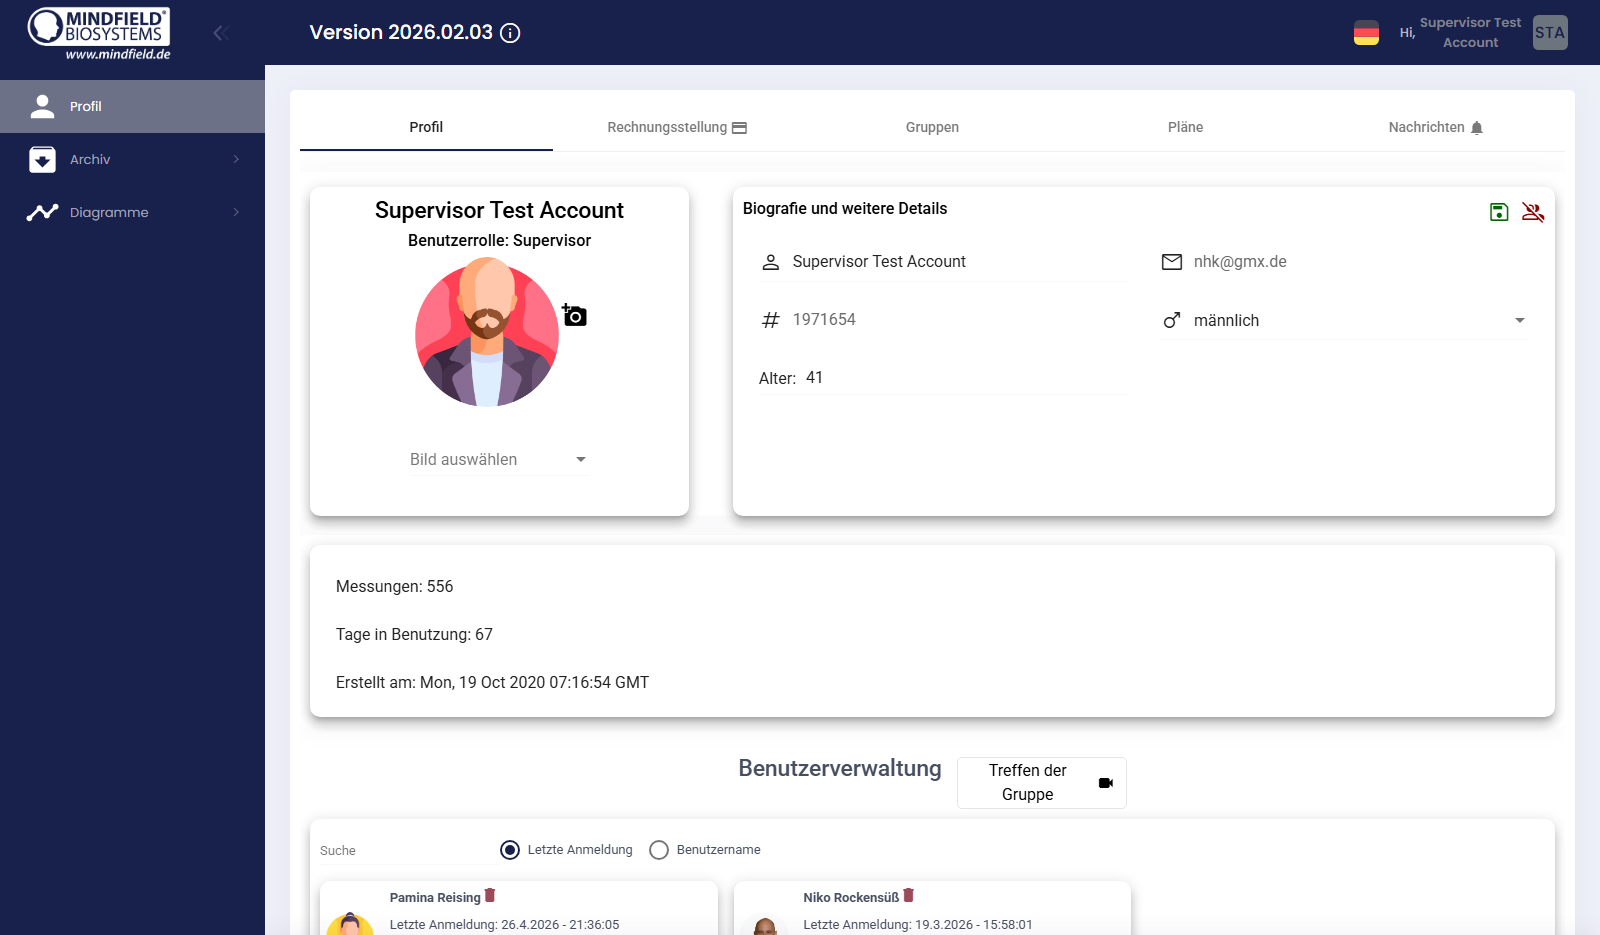
The top of the profile page shows five tabs that let you switch between the different profile areas:
- Profile – master data, role, statistics, user management
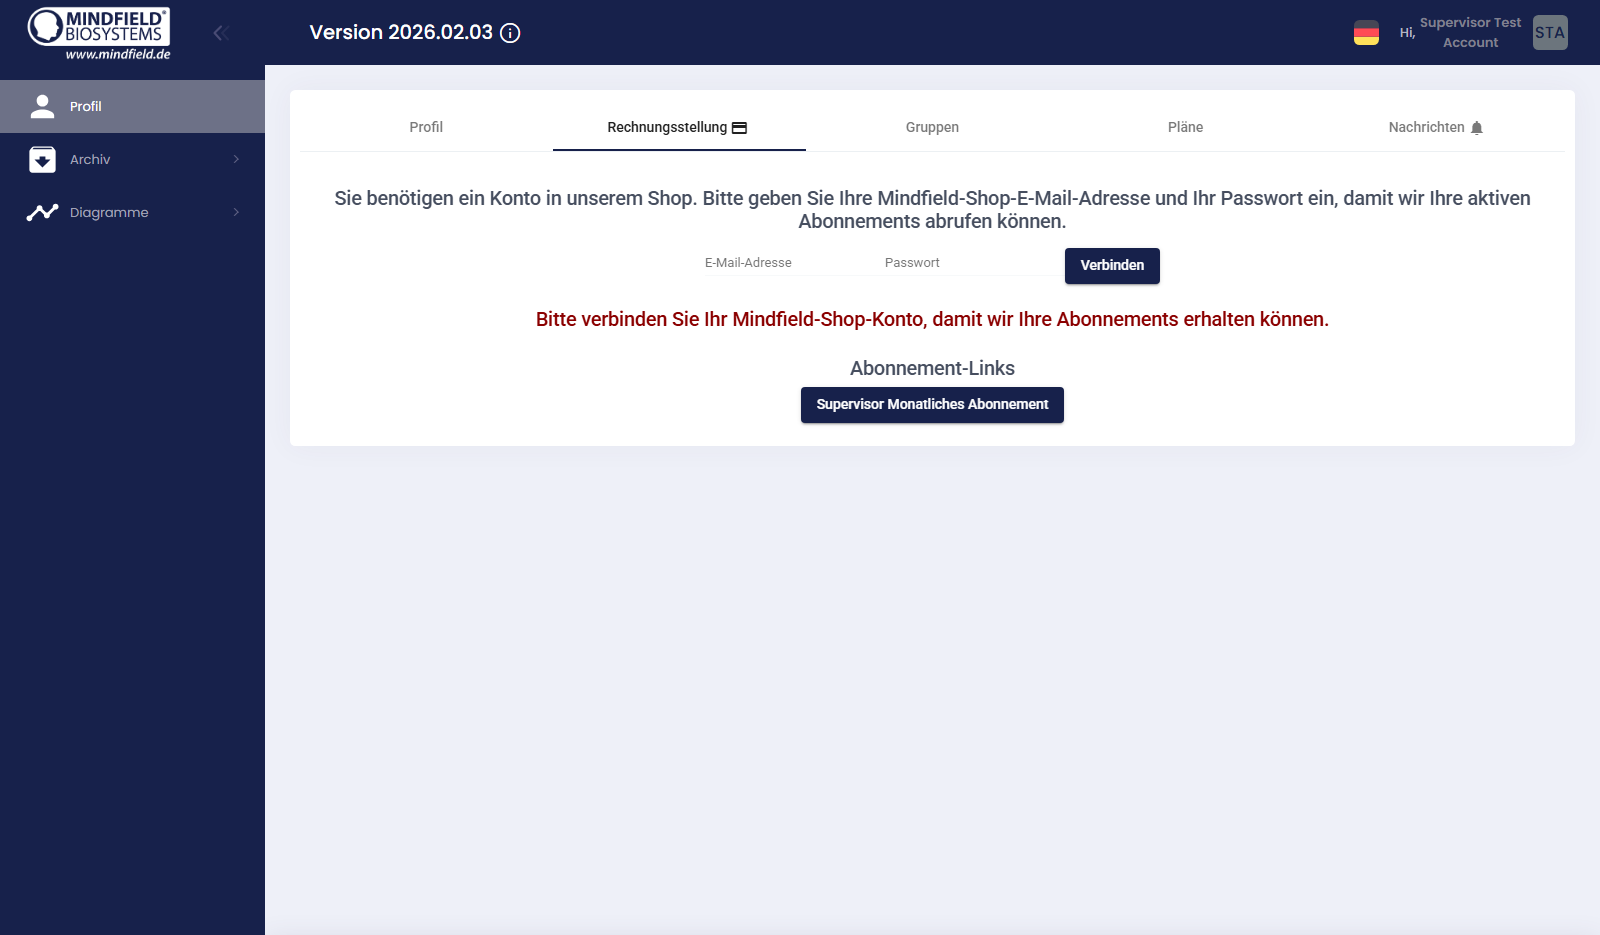
- Billing – connect your Mindfield Shop account, overview of active subscriptions
- Groups – group memberships (if you participate in a group training)
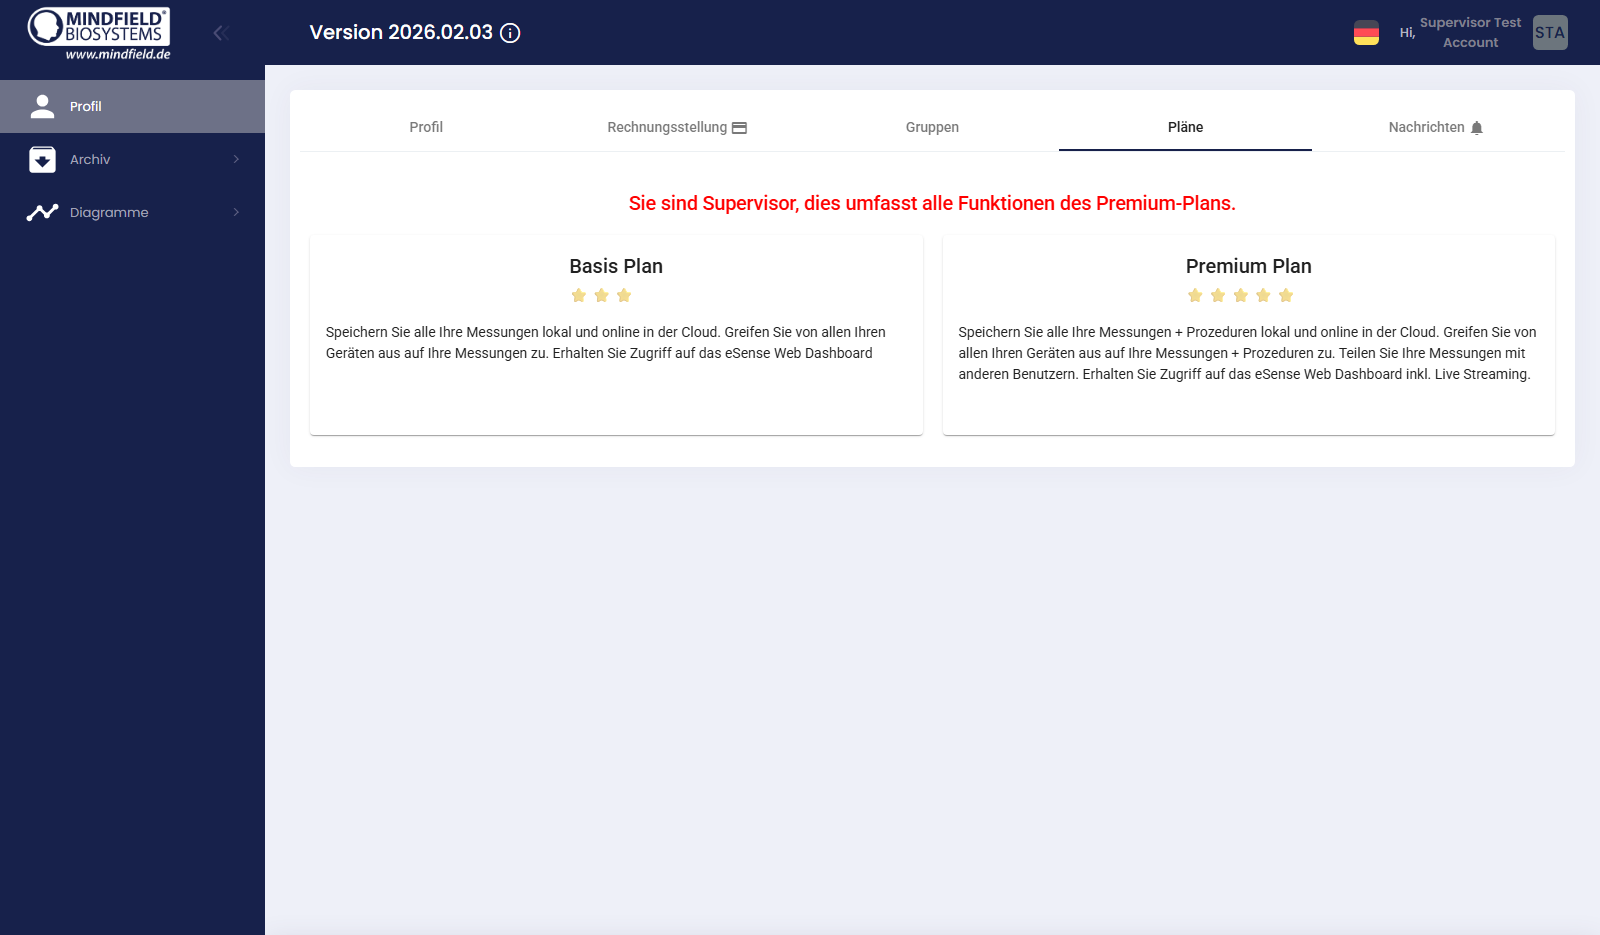
- Plans – current plan status (Basic/Premium/Supervisor) and plan comparison
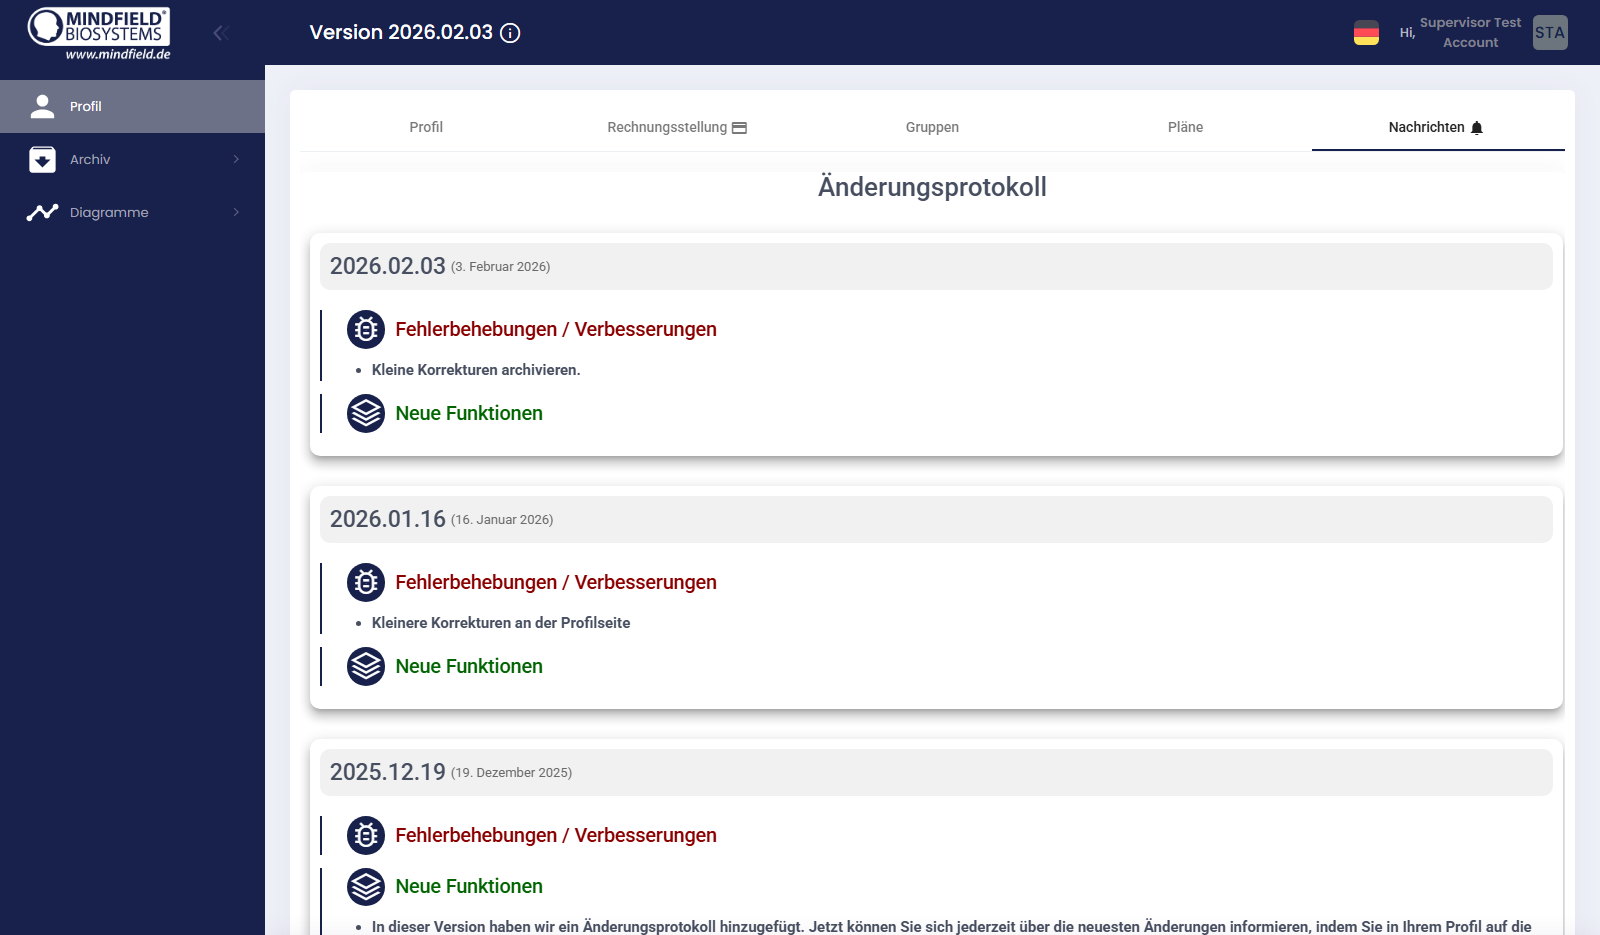
- News – Web App changelog with all new features and improvements
My Archive
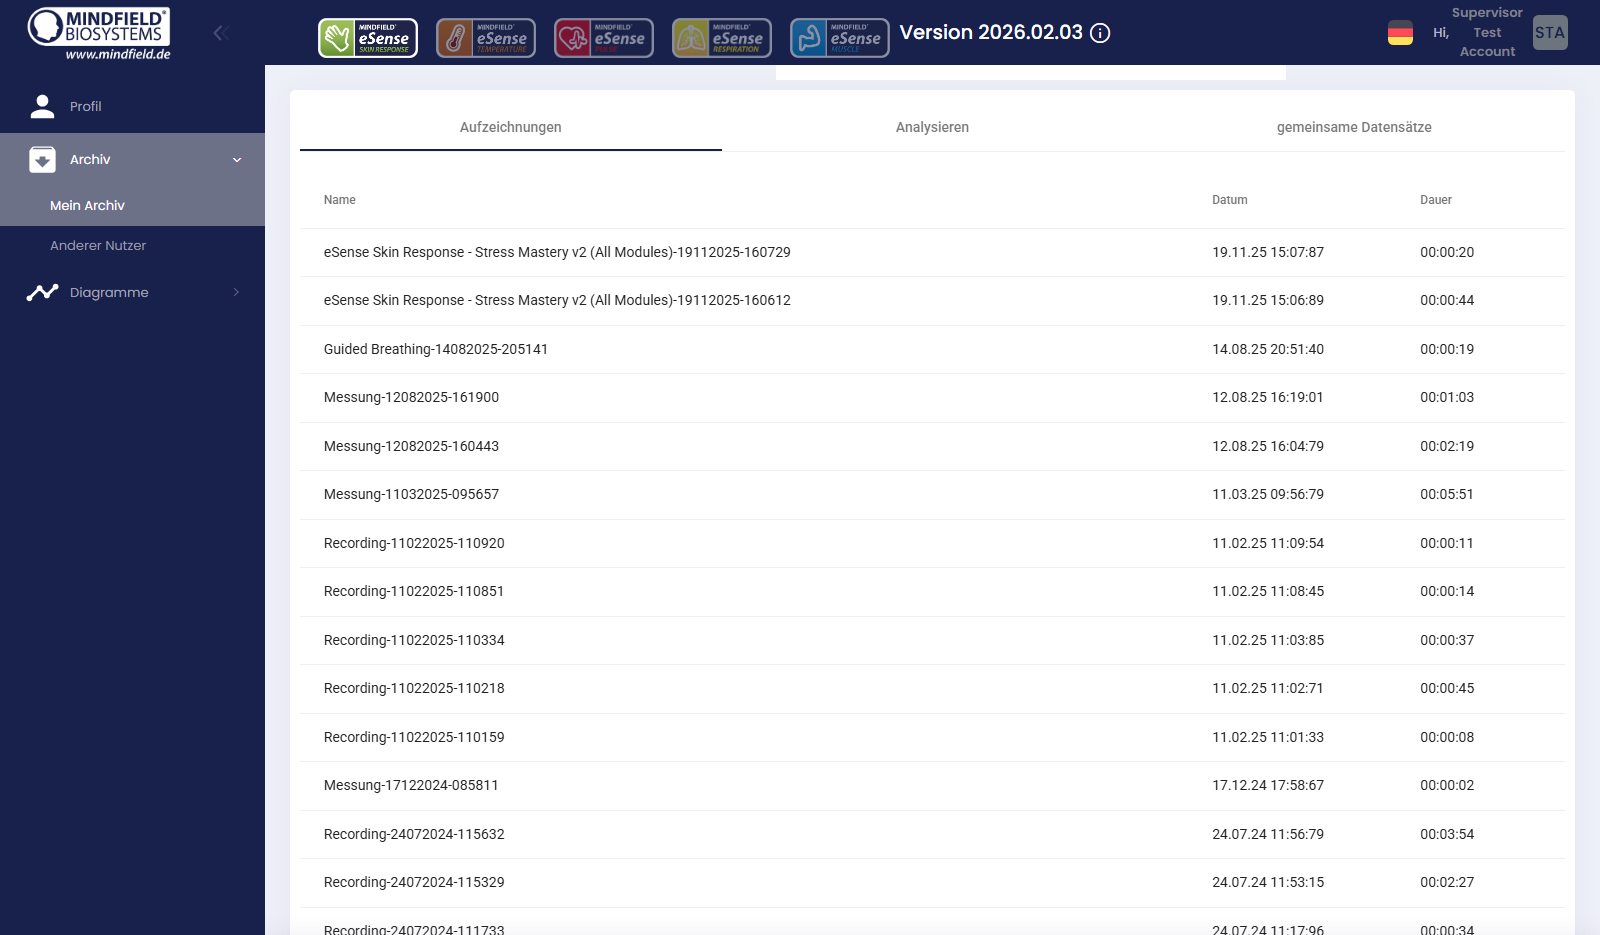
Under Archive → My Archive you find all recordings that have been synchronized with your account. You can filter by sensor, open individual recordings, compare several sessions and download the data as a CSV file.
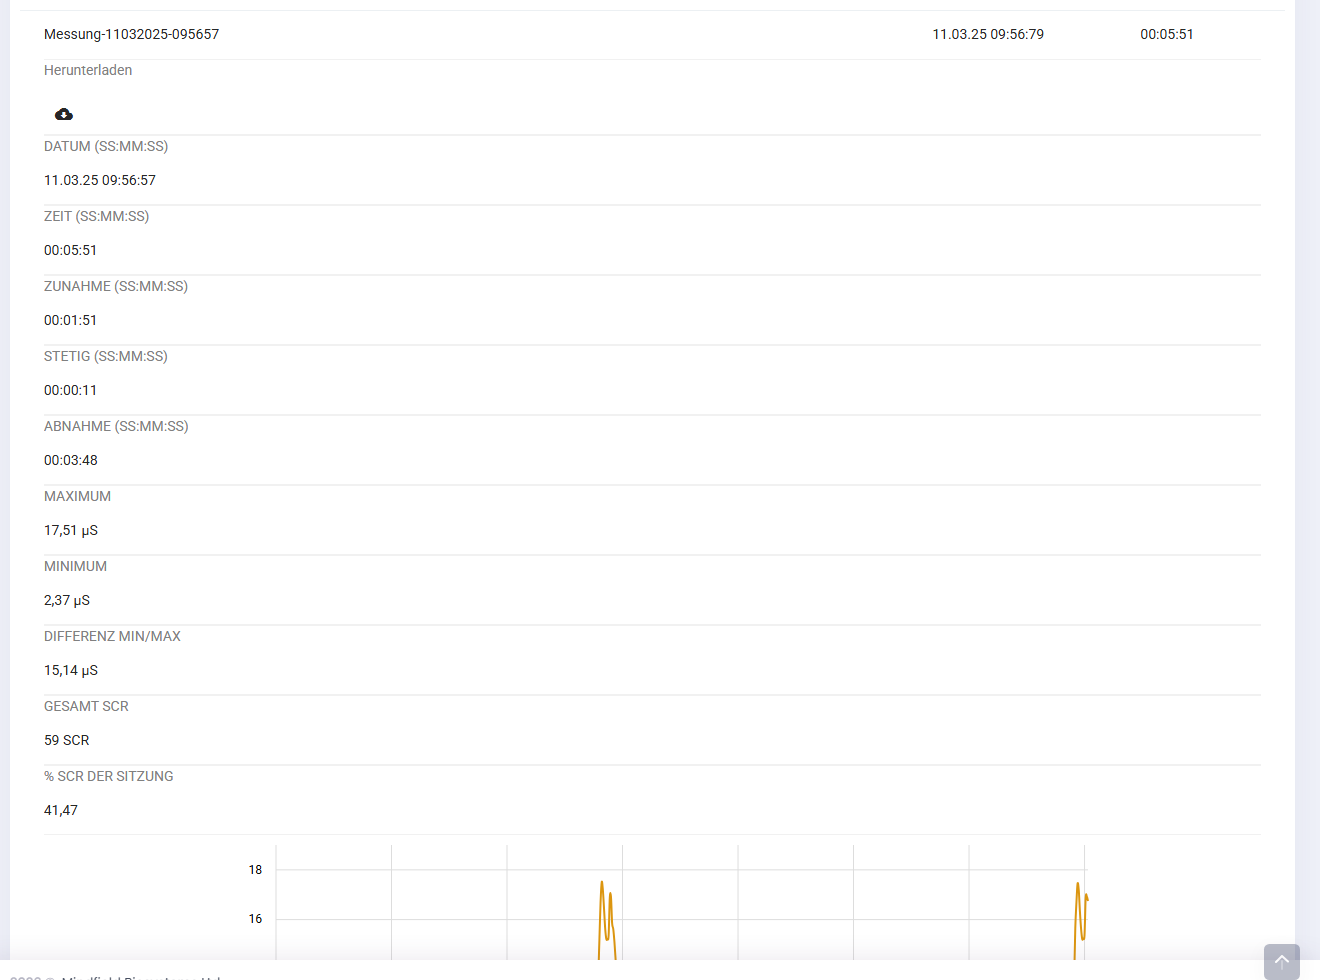
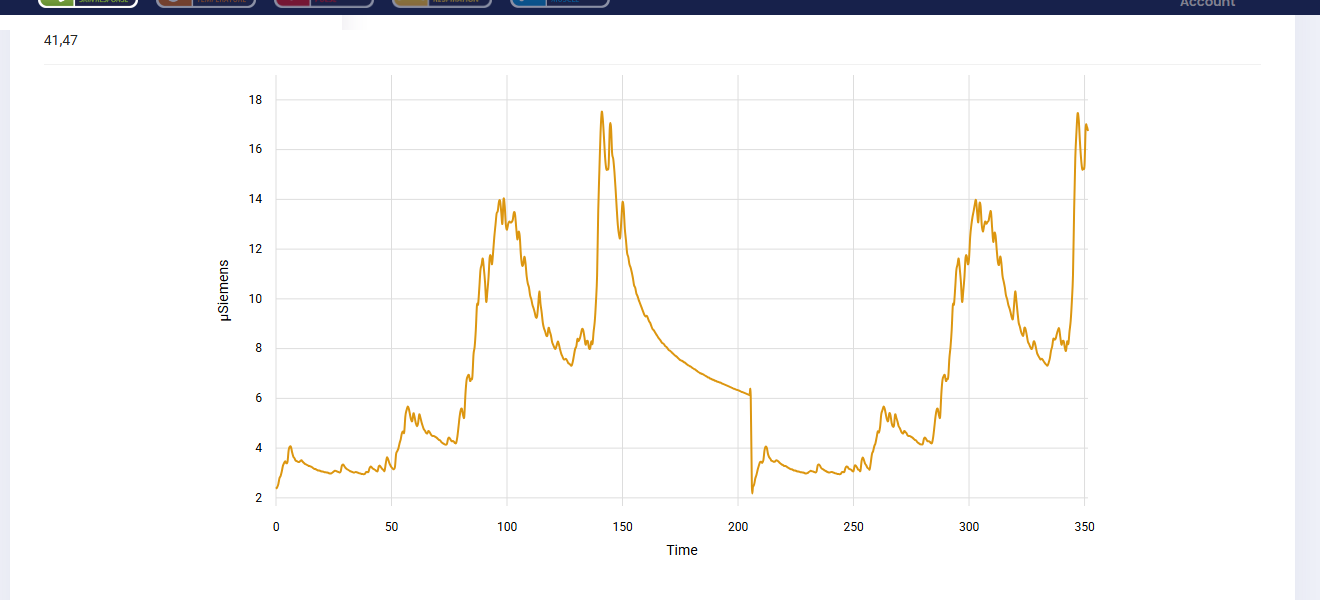
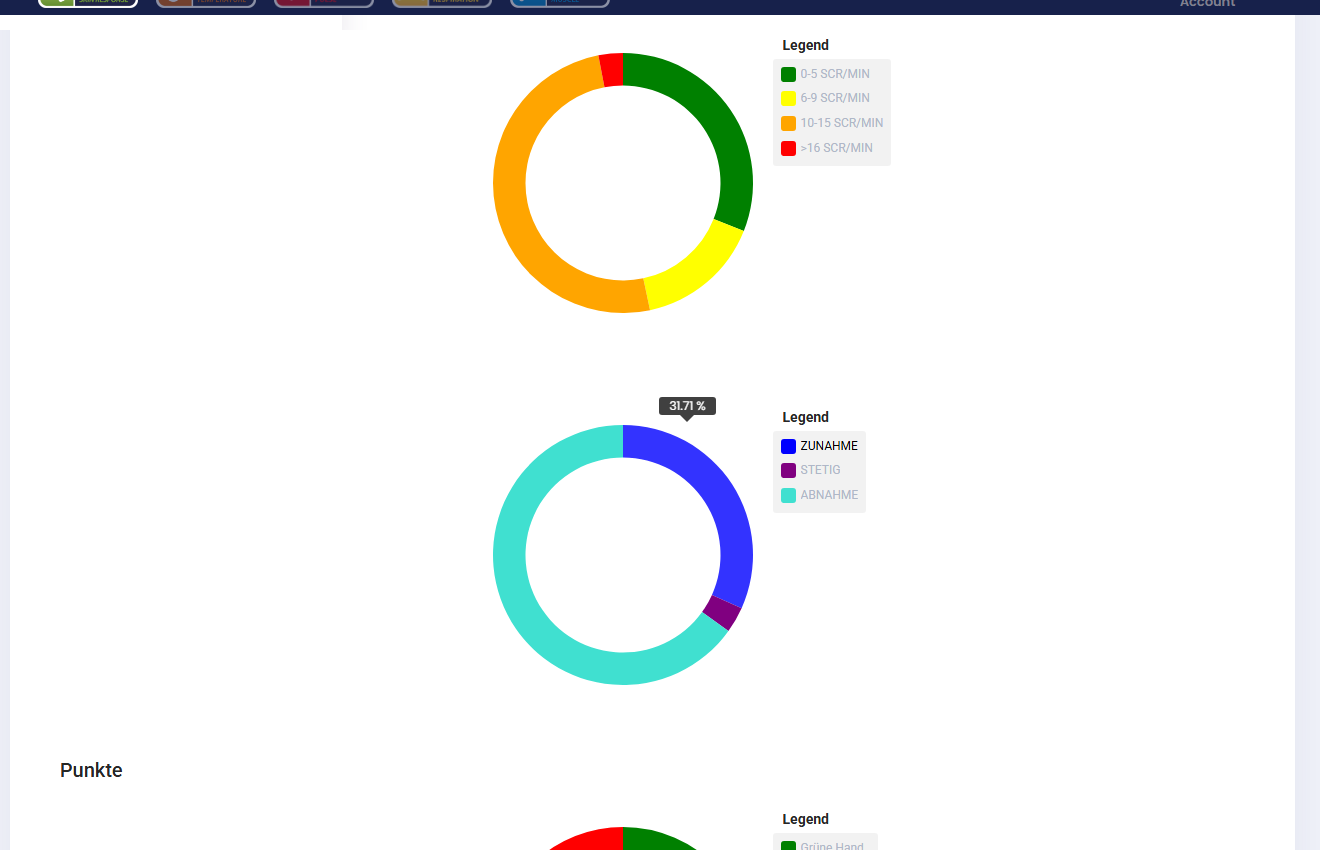
Clicking on a single recording opens a detailed analysis with numerical statistics, the curve over time and distribution charts.
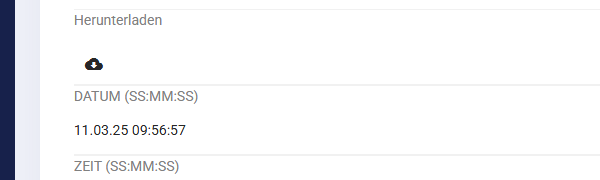
CSV export
The Download button on the detail view of a recording lets you save the raw data of the session as a CSV file. The format is well suited for further processing in Excel or other spreadsheet and statistics tools.
Note for users of the German version of Excel: the CSV file uses the English period as the decimal separator. A step-by-step guide for the correct column splitting can be found in our article Analysis of eSense data (CSV). A short answer to the export procedure is also available in FAQ: How can I export the measurements?
Switching between eSense sensors
The five sensor logos at the top of the Web App let you switch between the analyses of the different eSense sensors – Skin Response, Temperature, Pulse, Respiration and Muscle. Each sensor shows its own recordings, curves and statistics in the same detail view.

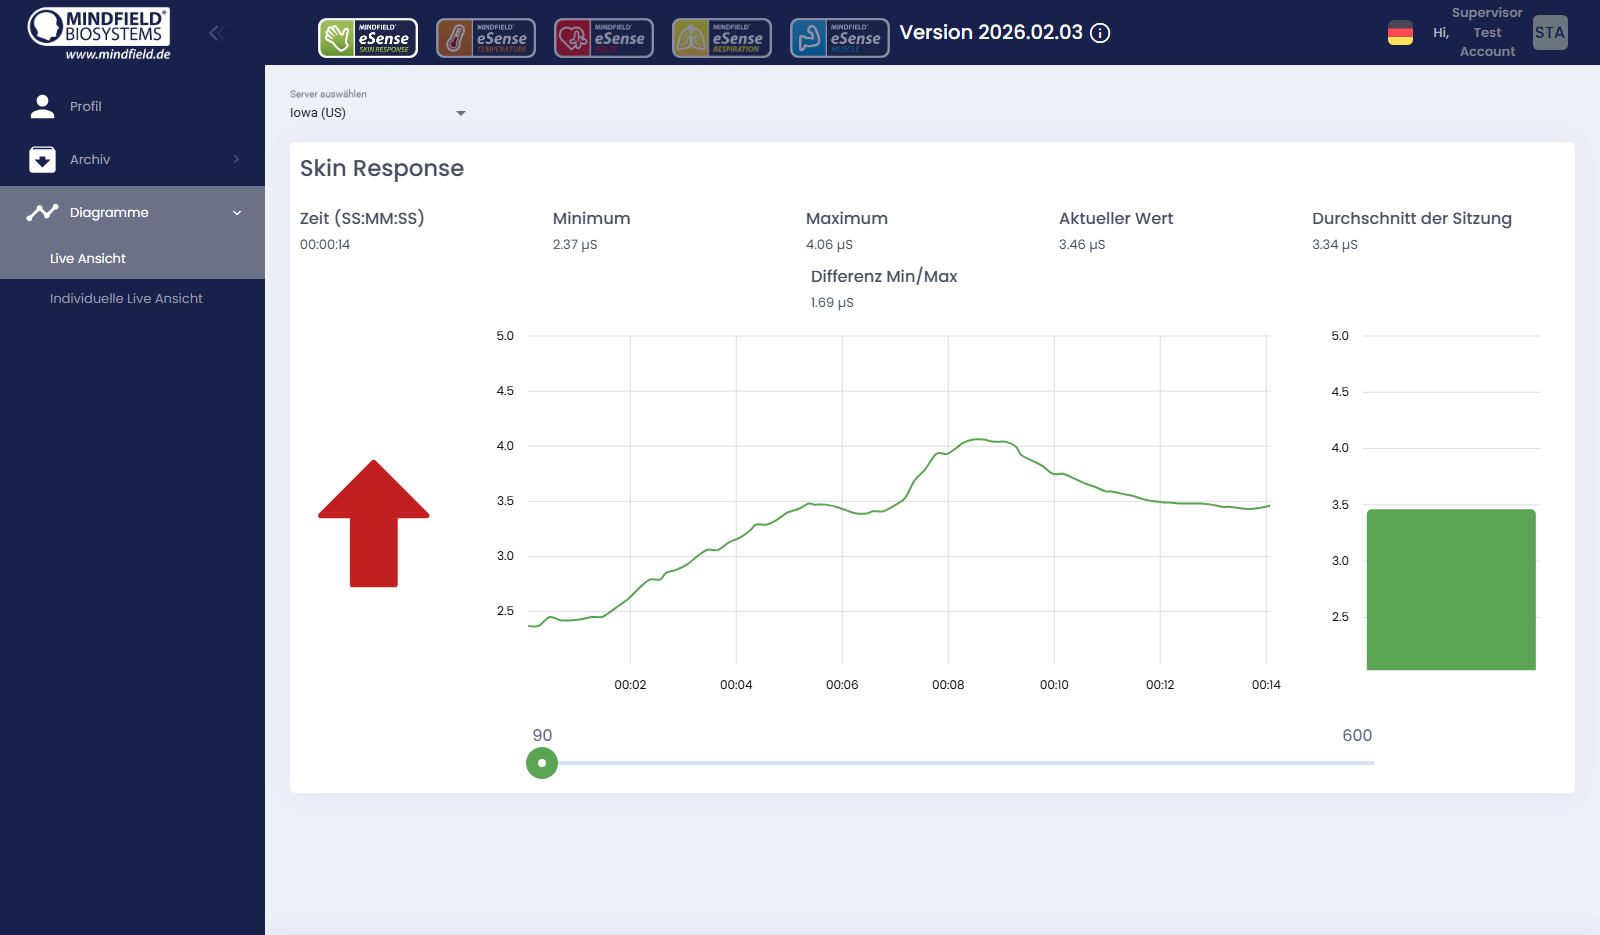
Live View (Premium)
With the Premium Plan you can stream a running measurement from the Mobile App to the Web App in real time. To activate this, open the eSense app and go to Settings → Real-time data transfer to eSense Web App, then start a measurement. In the browser you immediately see the live curve together with minimum, maximum, current and average values.


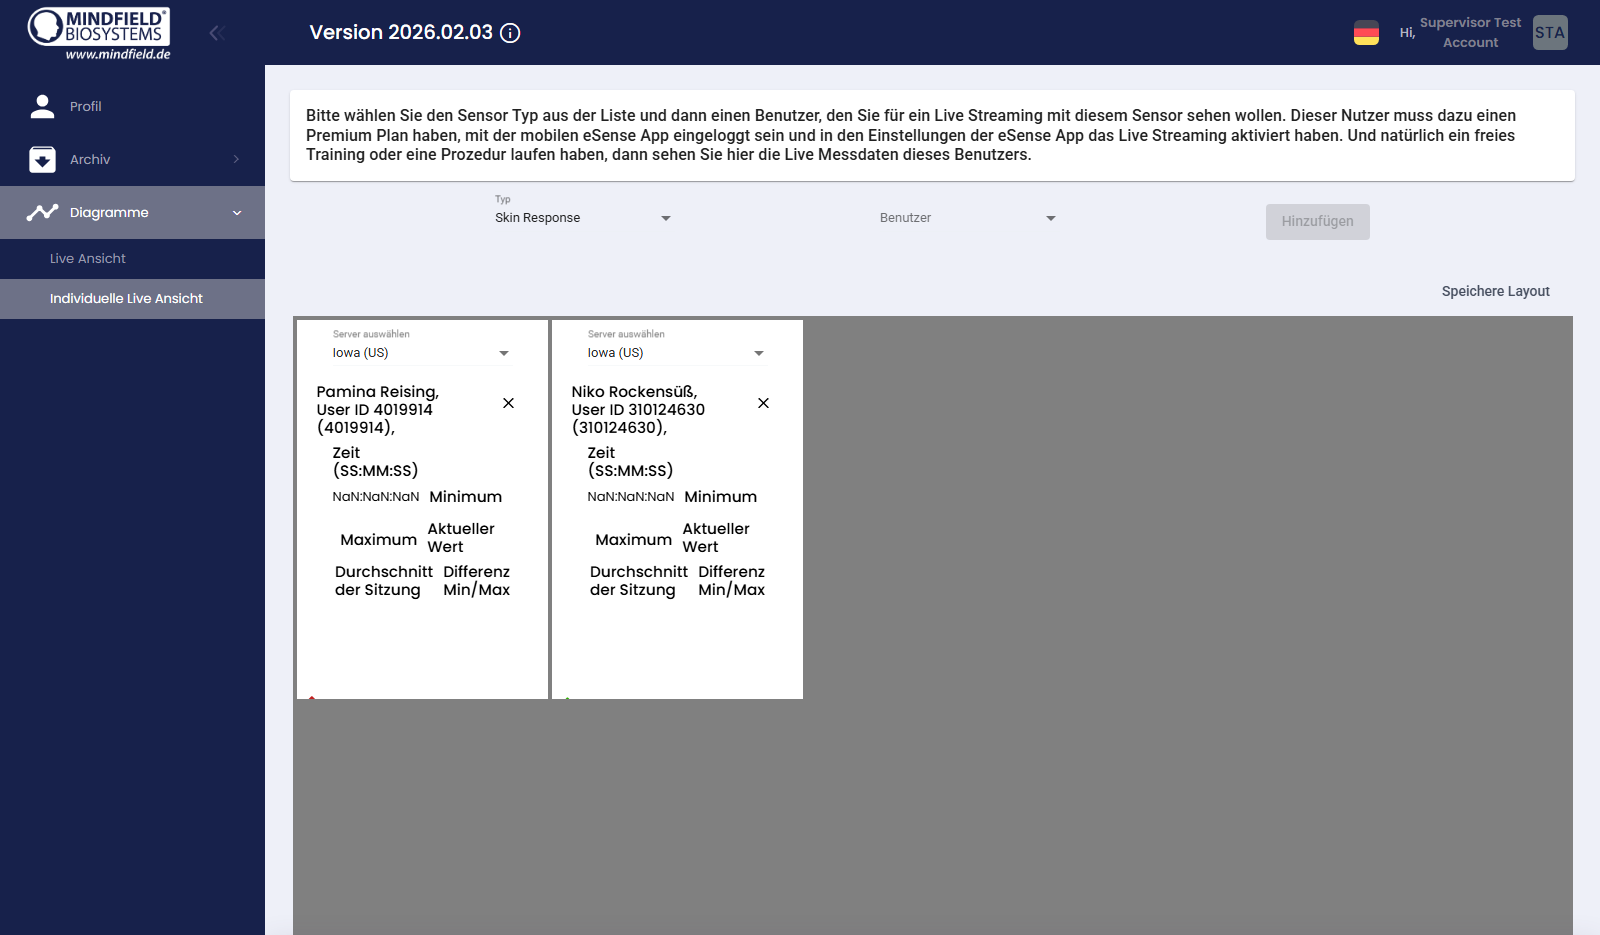
Custom Live View
Under Charts → Custom Live View you can build your own live view. Pick the sensor type and one or more users, then arrange the live tiles in a layout that suits your workflow. The custom layout can be saved and reloaded next time.
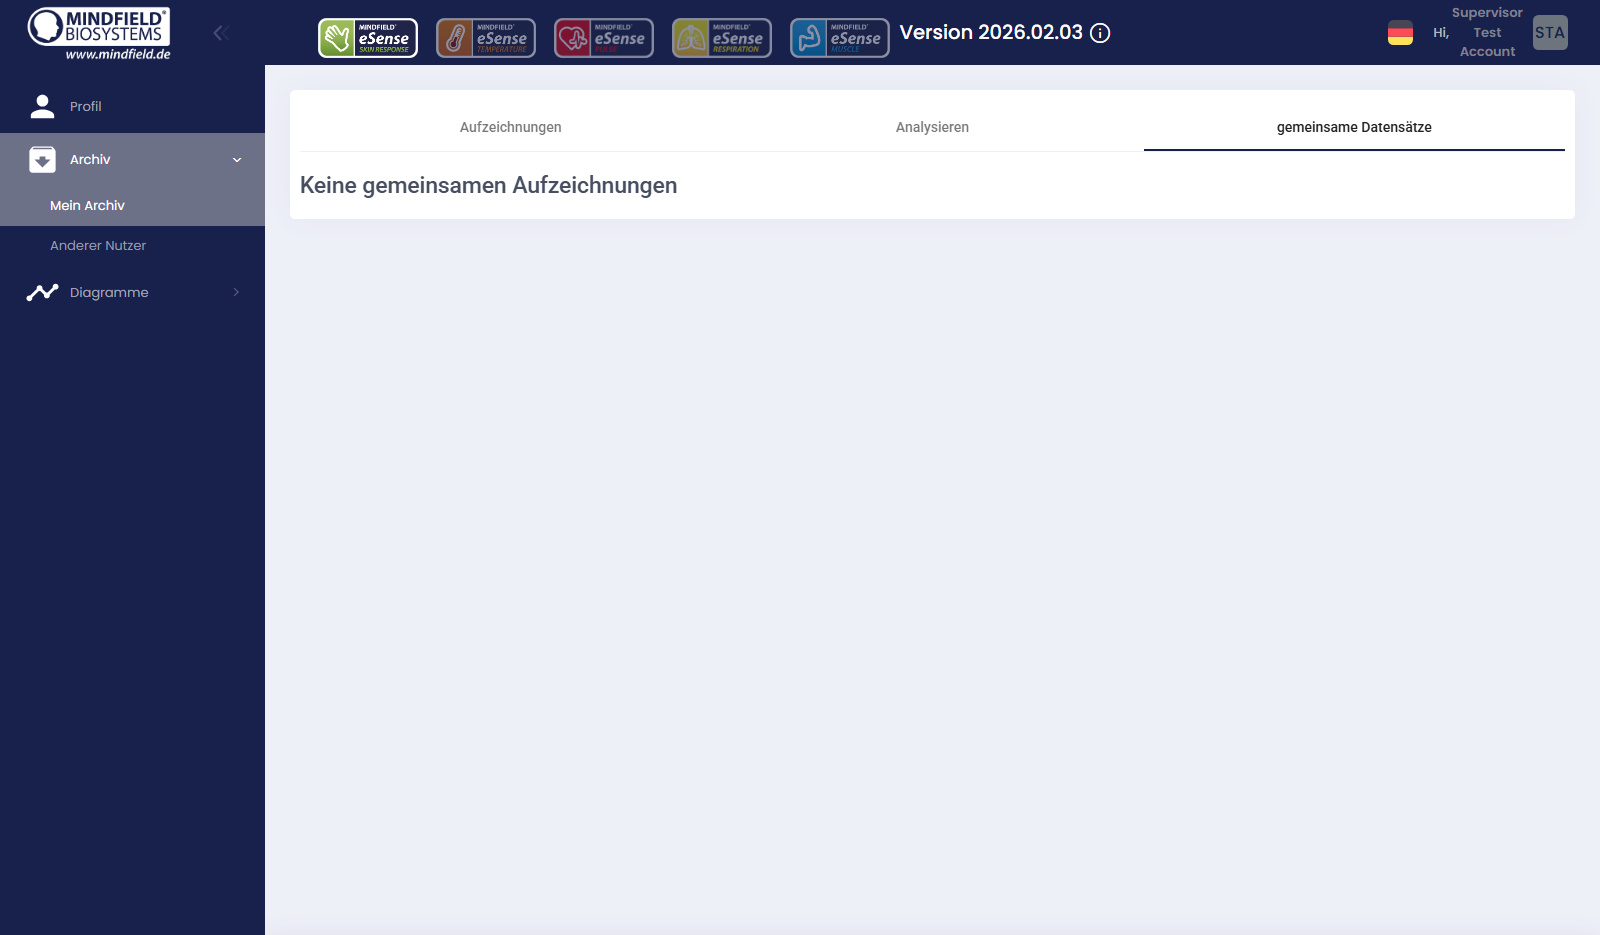
Shared Records
If another user shares a recording with you, it appears in the Shared Records tab inside „My Archive“. This way training progress can be exchanged transparently between client and trainer without having to share login credentials.
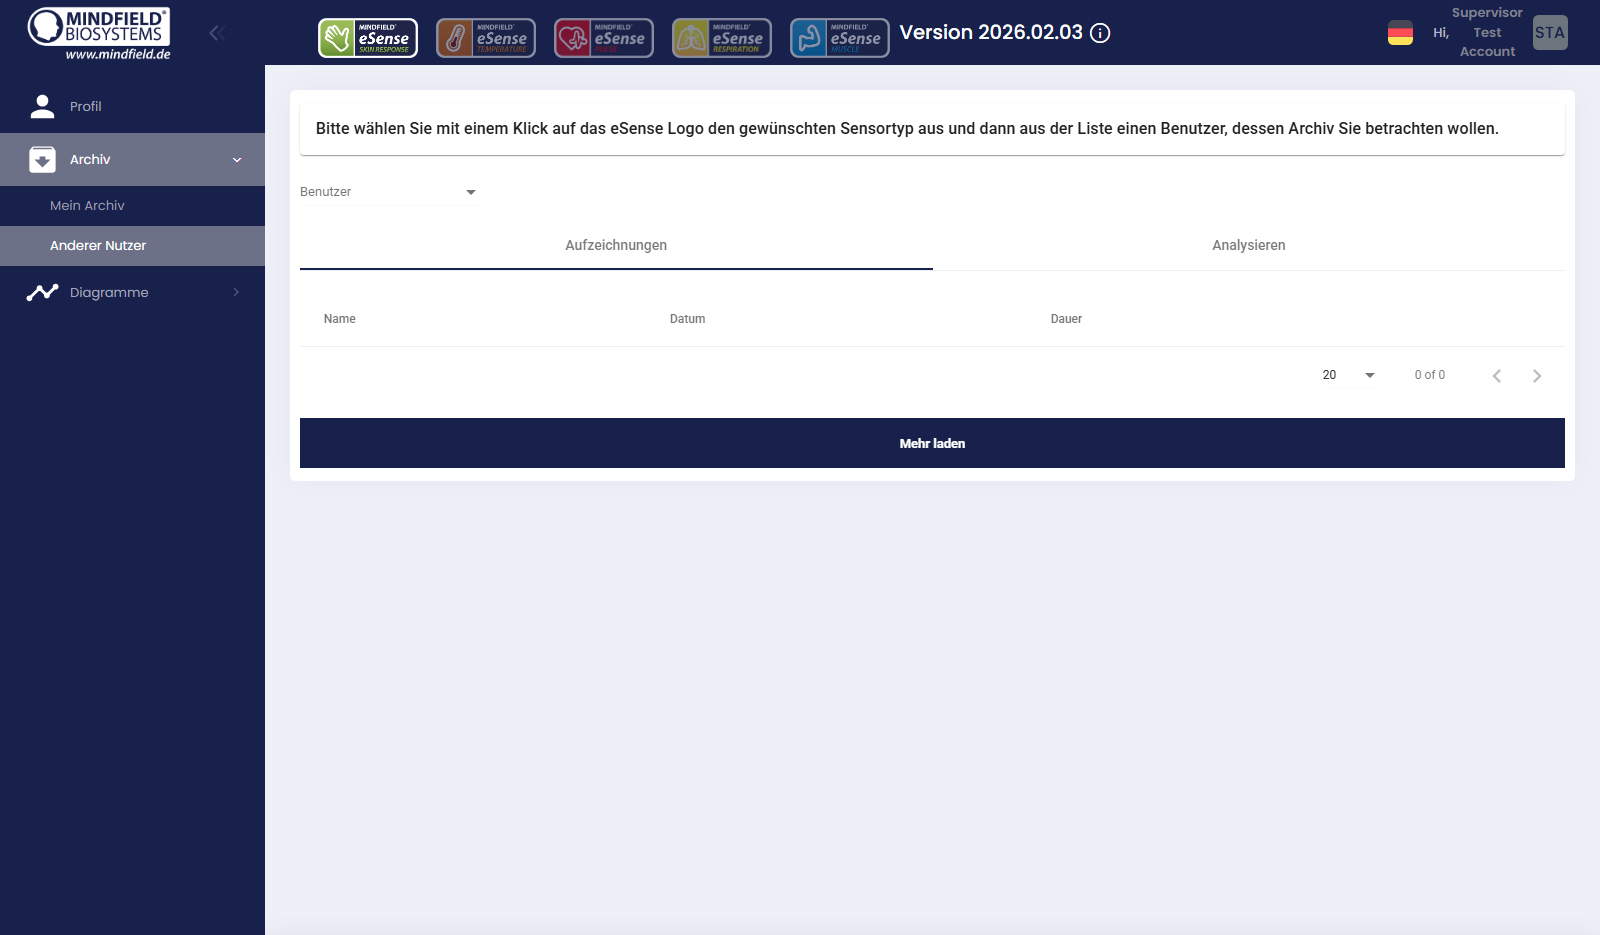
Supervisor features
Trainers, coaches and therapists can request the Supervisor role on demand. With it, several clients can be supervised live at the same time – both in the real-time view of running measurements and in the archive of completed sessions.
Important data protection note: Supervision is only possible after explicit authorization by the user concerned. Each user has to actively allow a Supervisor in their own profile to access their measurement or live data. Without this approval no access is possible.
A detailed manual for Supervisors is available in our Supervisor Guide.
Further reading
- Account and Cloud – basics about the account and cloud synchronization
- Account Comparison – Basic Plan and Premium Plan side by side
- Analysis of eSense data (CSV) – open and analyze CSV files in Excel
- FAQ: How can I export the measurements?
- Streaming eSense data to a PC/Mac/Browser (eSense Web App, OSC, LSL) – streaming options via Web App, OSC and LSL
- Supervisor Guide – detailed manual for Supervisors
The eSense App and the eSense Web App work with all our eSense sensors – with the exception of the eSense EEGenius, which is analyzed via its own dedicated software.