-
eSense Skin Response
-
- News
- Delivery contents Skin Response
- Technical Data
- All eSense in comparison
- Combination possibilities eSense sensors & Combined Feedback
- Example Measurements
- Analysis of eSense data (CSV)
- Streaming eSense data to a PC/Mac/Browser (eSense Web App, OSC, LSL)
- Duplicate eSense on a large screen (screen mirroring)
- Compatible Android and iOS devices
- Adapter for Android and Apple devices
- EC Declaration of Conformity
- Contact
-
- Functions of the Mindfield eSense App
- General notes
- Preparation and start of the app
- General view & Open Training
- Breath Pacer (optional)
- Biofeedback Snake
- Survey (optional)
- Pie charts (after a measurement)
- Procedure Overview
- Procedure editor
- Add new module
- Overview of the modules
- Creation of a procedure
- Meditations
- Own media (photos, videos and audios)
- Settings (Overview)
- In App Purchases
- Archive (overview)
- Archive (individual view)
- Marker feature
- Virtual Reality (VR) (f.i. Meta Quest 3)
- Compatible Android and iOS devices
- Adapter for Android and Apple devices
- Combination possibilities eSense sensors & Combined Feedback
- Privacy policy
- Apple Health and Health Connect
- Redeem a promo code
- Demo Mode and connection check
- The oscilloscope
- Threshold feedback
- eSense SDK – eSense sensors in your own apps (Android, iOS/macOS, Windows)
- Show all articles (1) Collapse Articles
-
- All eSense at a glance
- Biofeedback with the eSense Skin Response
- Create Custom Procedures
- eSense App Cloud Functions
- eSense app demo
- eSense Web App
- How to use the eSense Skin Response (Requierements for devices, iOS&Android and troubleshooting)
- Individual media in iOS
- Biofeedback with eSense Sensors + App: Control Philips Hue Bulbs via Bluetooth
- Getting Started with eSense Skin Response - Setup, Electrodes & Troubleshooting
-
- Can I also use (Bluetooth®-)speakers instead of headphones with the eSense?
- Can I change the language in the app?
- How can I export the measurements?
- How do I use my own audio or video?
- Is the app available in dark mode?
- My eSense does not work with iOS 9 (or higher).
- My eSense is not working
- My procedures are not synchronized correctly.
- My smartphone / tablet has no more 3.5mm jack input, which adapter do I need?
- The app still displays strongly fluctuating or senseless values. Touching or releasing the sensors of the Skin Response or the Temperature does not make a difference.
- The values for the eSense Skin Response are very small (below 1.0 µS). What can I do to improve the quality of measurement?
- What is the purpose of the accounts and the cloud in the eSense app? Do I need an account?
- Which App do I need and where can I download it?
- Which electrodes are working with the eSense?
-
-
eSense Temperature
-
- News
- Delivery contents eSense Temperature
- Technical Data
- All eSense in comparison
- Combination possibilities eSense sensors & Combined Feedback
- Example Measurements
- Analysis of eSense data (CSV)
- Streaming eSense data to a PC/Mac/Browser (eSense Web App, OSC, LSL)
- Duplicate eSense on a large screen (screen mirroring)
- Compatible Android and iOS devices
- Adapter for Android and Apple devices
- EC Declaration of Conformity
- Contact
-
- Functions of the Mindfield eSense App
- General notes
- Preparation and start of the app
- General view & Open Training
- Breath Pacer
- Biofeedback Snake
- Survey (optional)
- Pie charts (after a measurement)
- Procedure Overview
- Procedure editor
- Add new module
- Overview of the modules
- Creation of a procedure
- Meditations
- Own media (photos, videos and audios)
- Settings (Overview)
- In App Purchases
- Archive (overview)
- Archiv (individual view)
- Marker feature
- Virtual Reality (VR) (f.i. Meta Quest 3)
- Compatible Android and iOS devices
- Adapter for Android and Apple devices
- Combination possibilities eSense sensors & Combined Feedback
- Privacy policy
- Apple Health and Health Connect
- Redeem a promo code
- Demo Mode and connection check
- The oscilloscope
- Threshold feedback
- eSense SDK – eSense sensors in your own apps (Android, iOS/macOS, Windows)
- Show all articles (1) Collapse Articles
-
- Can I also use (Bluetooth®-)speakers instead of headphones with the eSense?
- Can I change the language in the app?
- How can I export the measurements?
- How do I use my own audio or video?
- Is the app available in dark mode?
- My eSense does not work with iOS 9 (or higher).
- My eSense is not working
- My procedures are not synchronized correctly.
- My smartphone / tablet has no more 3.5mm jack input, which adapter do I need?
- The app still displays strongly fluctuating or senseless values. Touching or releasing the sensors of the Skin Response or the Temperature does not make a difference.
- What is the purpose of the accounts and the cloud in the eSense app? Do I need an account?
- Which App do I need and where can I download it?
-
-
eSense Pulse
-
- News
- Delivery contents eSense Pulse
- Technical Data
- Example Measurements
- All eSense in comparison
- Comparison measurement eSense Pulse & Faros 180
- Combination possibilities eSense sensors & Combined Feedback
- Analysis of eSense data (CSV)
- Streaming eSense data to a PC/Mac/Browser (eSense Web App, OSC, LSL)
- Duplicate eSense on a large screen (screen mirroring)
- eSense Pulse & Bittium Faros 180 Comparison
- Compatible Android and iOS devices
- Troubleshooting connection problems
- EC Declaration of Conformity
- Contact
-
- Functions of the Mindfield eSense App
- General notes
- Preparation and start of the app
- General view & Open Training
- Breath Pacer
- Biofeedback Snake
- Spectrogram
- Survey (optional)
- Pie chart (after the measurement)
- Procedure Overview
- Procedure editor
- Add new module
- Overview of the modules
- Creation of a procedure
- Meditations
- Own media (photos, videos and audios)
- General settings
- In App Purchases
- eSense Pulse Analysis
- Explanation of the individual measured values
- Archive (overview)
- Archive (single view)
- Marker feature
- Virtual Reality (VR) (f.i. Meta Quest 3)
- Combination possibilities eSense sensors & Combined Feedback
- Compatible Android and iOS devices
- Troubleshooting connection problems
- Privacy policy
- Apple Health and Health Connect
- Redeem a promo code
- Demo Mode and connection check
- The oscilloscope
- Threshold feedback
- Polar H10 (alternative pulse sensor)
- eSense SDK – eSense sensors in your own apps (Android, iOS/macOS, Windows)
- Show all articles (5) Collapse Articles
-
- All eSense at a glance
- Create Custom Procedures
- eSense App Cloud Functions
- eSense app demo
- eSense Pulse Combined Feedback
- eSense Web App
- Individual media in iOS
- Mindfield Concept for Heart Rate Variability (HRV)
- Pulse - Heart Rate Variability
- Pulse biofeedback sensor for heart rate variability
- Biofeedback with eSense Sensors + App: Control Philips Hue Bulbs via Bluetooth
-
- Can I also use (Bluetooth®-)speakers instead of headphones with the eSense?
- Can I change the language in the app?
- How can I export the measurements?
- How do I use my own audio or video?
- Is the app available in dark mode?
- My eSense does not work with iOS 9 (or higher).
- My eSense is not working
- My procedures are not synchronized correctly.
- The app doesn’t find the eSense Pulse
- What battery belongs in the eSense Pulse?
- What is the purpose of the accounts and the cloud in the eSense app? Do I need an account?
- Which App do I need and where can I download it?
- Why are some parameters (e.g. SDNN, RMSSD, pNN50) a bit different in the eSense app than in the Kubios software?
-
-
eSense Respiration
-
- News
- Delivery contents eSense Respiration
- Example Measurements
- All eSense in comparison
- Combination possibilities eSense sensors & Combined Feedback
- Analysis of eSense data (CSV)
- Streaming eSense data to a PC/Mac/Browser (eSense Web App, OSC, LSL)
- Duplicate eSense on a large screen (screen mirroring)
- Compatible Android and iOS devices
- Adapter for Android and Apple devices
- Cleaning and Care
- Troubleshooting Measuring Signal and Breathing Belt
- EC Declaration of Conformity
- Contact
-
- Functions of the Mindfield eSense App
- General notes
- Preparation and start of the app
- General view & Open Training
- Breath Pacer
- Biofeedback Snake
- Survey (optional)
- Pie Chart (after the measurement)
- Procedure Overview
- Procedure editor
- Add new module
- Overview of the modules
- Creation of a procedure
- Meditations
- Own media (photos, videos and audios)
- General settings
- In App Purchases
- Archive (overview)
- Archive (single view)
- Marker feature
- Virtual Reality (VR) (f.i. Meta Quest 3)
- Compatible Android and iOS devices
- Adapter for Android and Apple devices
- Explanation of the Individual Measured Values
- Combination possibilities eSense sensors & Combined Feedback
- Privacy policy
- Apple Health and Health Connect
- Redeem a promo code
- Demo Mode and connection check
- The oscilloscope
- Threshold feedback
- eSense SDK – eSense sensors in your own apps (Android, iOS/macOS, Windows)
- Show all articles (2) Collapse Articles
-
- Can I also use (Bluetooth®-)speakers instead of headphones with the eSense?
- Can I change the language in the app?
- How can I export the measurements?
- How do I use my own audio or video?
- I do not get any (reasonable) measured values, what can I do?
- Is the app available in dark mode?
- My eSense does not work with iOS 9 (or higher).
- My eSense is not working
- My procedures are not synchronized correctly.
- My smartphone / tablet has no more 3.5mm jack input, which adapter do I need?
- What is the purpose of the accounts and the cloud in the eSense app? Do I need an account?
- Which App do I need and where can I download it?
-
-
eSense Muscle
-
- News
- Delivery contents eSense Muscle
- Note Pro and Home version
- Note on the Apps
- Technical Data
- All eSense in comparison
- Analysis of eSense data (CSV)
- Streaming eSense data to a PC/Mac/Browser (eSense Web App, OSC, LSL)
- Duplicate eSense on a large screen (screen mirroring)
- Battery Information
- Compatible Android and iOS devices
- Troubleshooting connection problems
- EC Declaration of Conformity
- Contact
-
- Articles coming soon
-
- Note on the Apps
- Notes before starting the eSense Mobile App
- Preparation and start of the eSense Mobile App
- General notes
- General view & Open Training
- Contraction Helper
- Survey (optional)
- Analysis (after the measurement)
- Procedure Overview
- Procedure editor
- Add new module
- Overview of the modules
- Creation of a procedure
- Meditations
- Own media (photos, videos and audios)
- General settings
- In App Purchases
- Archive (overview)
- Archive (single view)
- Marker feature
- Virtual Reality (VR) (f.i. Meta Quest 3)
- Compatible Android and iOS devices
- Privacy policy
- Apple Health and Health Connect
- Redeem a promo code
- Demo Mode and connection check
- The oscilloscope
- Threshold feedback
- eSense SDK – eSense sensors in your own apps (Android, iOS/macOS, Windows)
-
- eSense Muscle Demo (Short Version)
- eSense Muscle Demo (Long Version)
- Demo of the eSense Muscle Mobile App
- Demo of the eSense Muscle Web App
- Create Custom Procedures
- eSense App Cloud Functions
- eSense Muscle Web App with NVIDIA & ATI graphics card (Windows)
- Individual media in iOS
- eSense Muscle Web App Demo (Full Version)
- Muscle eSense Mobile App Demo
-
- Can I also use (Bluetooth®-)speakers instead of headphones with the eSense?
- Can I change the language in the app?
- How can I export the measurements?
- How do I use my own audio or video?
- Is the app available in dark mode?
- My eSense does not work with iOS 9 (or higher).
- My eSense is not working
- My procedures are not synchronized correctly.
- The app doesn’t find the eSense Muscle.
- What is the purpose of the accounts and the cloud in the eSense app? Do I need an account?
- Which App do I need and where can I download it?
-
-
MindMaster
-
Service & Downloads
eSense Pulse Analysis
For the eSense Pulse, we have created a detailed analysis that you can find in the individual view in the archive. Additionally, we offer you the option (as an in-app purchase) to compare your measurements with important HRV parameters from the meta-analysis by Nunan et al., 2010, specific to age and gender. These comparison data are also included in the CSV export file of a measurement.
Origin of the comparative data
Our comparative values come from the study “A Quantitative Systematic Review of Normal Values for Short-Term Heart Rate Variability in Healthy Adults”, published in November 2010 in the journal Pacing and Clinical Electrophysiology.
This study analyzes extensive data on short-term HRV measurements in healthy adults. To provide you with guidance, we compare your measurement results with the average values from this study.
We chose this study as a reference because it offers a comprehensive data foundation. It is based on 44 individual studies with a total of 21,438 participants, published between January 1997 and September 2008. You can view the complete study here: https://pubmed.ncbi.nlm.nih.gov/20663071.
Important note on interpretation
Please note that deviations from the average are not necessarily negative. The comparative values serve only as guidance. If you are uncertain or notice unusual values, we recommend consulting a specialist or expert to properly interpret your HRV results.
Individual measurements
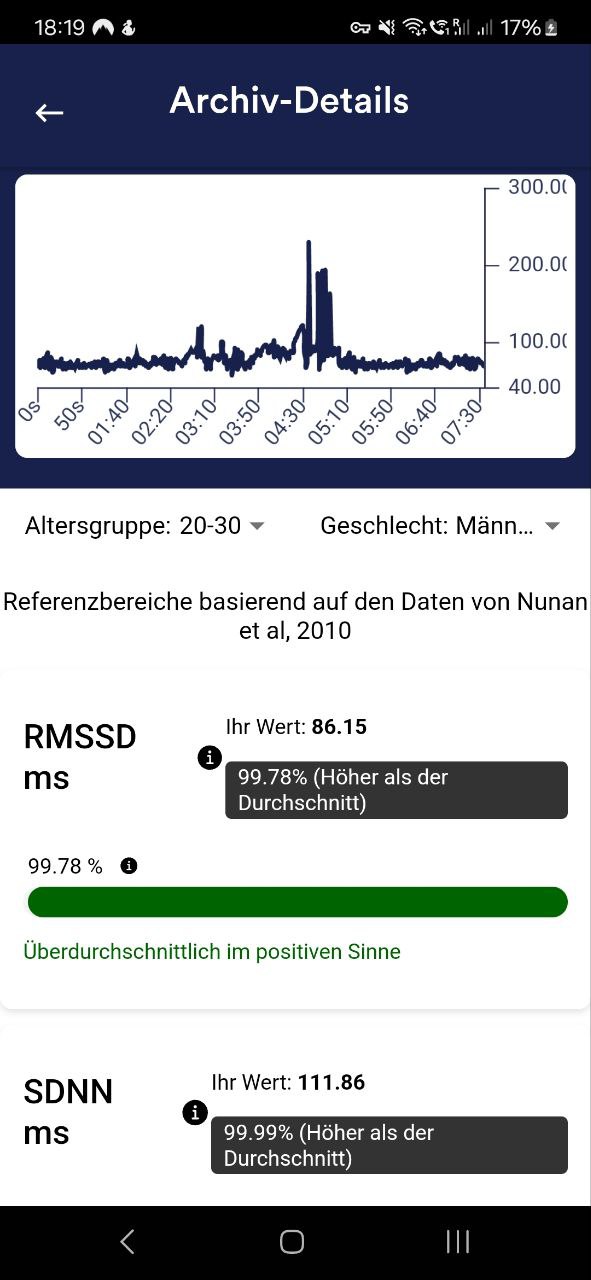
RMSSD ms
RMSSD (Root Mean Square of Successive Differences) is a measure of heart rate variability (HRV) that shows how much your heartbeat changes from one beat to the next. Higher RMSSD values generally indicate better heart health and relaxation, while lower values may suggest stress or fatigue.
SDNN ms
SDNN (Standard Deviation of NN Intervals) measures the overall variability of your heartbeat over time. A higher SDNN value typically indicates better heart health and adaptability, while a lower value may suggest stress or poor heart function.
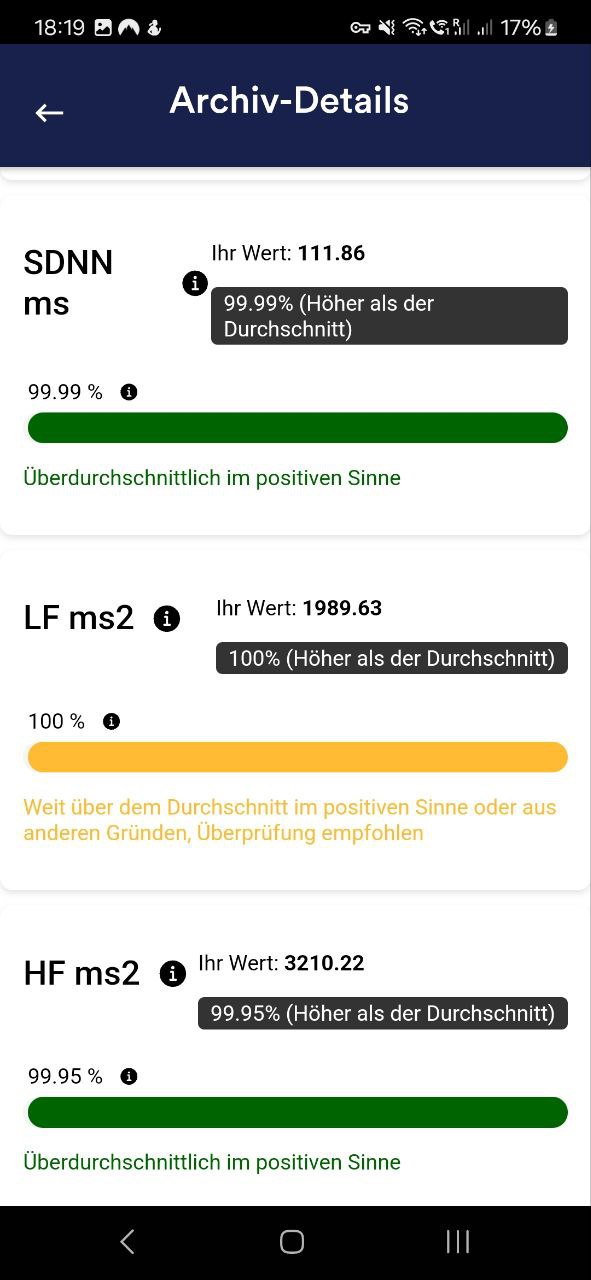
LF ms2
LF (Low Frequency) is a measure of heart rate variability (HRV) that reflects both the body’s stress response and part of the nervous system that controls heart rate. Higher LF values may indicate better adaptability, while very high or very low values may suggest stress or imbalance.
HF ms2
HF (High Frequency) is a measure of heart rate variability (HRV) associated with relaxation and the activity of the parasympathetic nervous system (which helps the body rest and recover). Higher HF values typically indicate better relaxation and stress resilience, while lower HF values may suggest stress or fatigue.
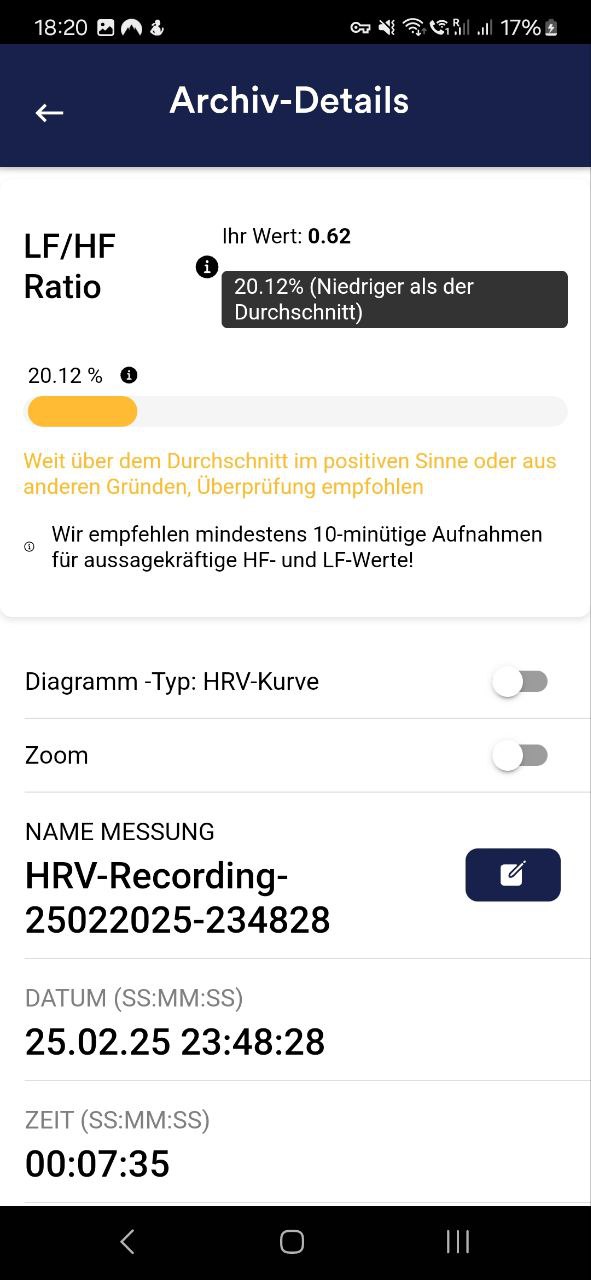
LF/HF Ratio
The LF/HF (Low Frequency to High Frequency) ratio is a measure of the balance between stress (LF) and relaxation (HF) in heart rate variability (HRV). A higher LF/HF ratio may indicate more stress or activity, while a lower ratio suggests relaxation and recovery.
Score (developed specifically by Mindfield)
For the Mindfield app, we have developed our own score system. This score, developed by us, should simply tell you how good your heart rate variability is with just one number.
Simply put, the better your heart rate variability, the higher this value.
In detail: The score is the sum of the regularity of the curve (in percent) and the amplitude (absolute value) divided by the rate of data from eSense Pulse (which transmits the last measured values via Bluetooth® every 200 ms) plus the previous score.
Therefore

Whereby the time interval between Score and Score0 is just 200ms. If Regularity Percent << 90 then:

Thus, especially measurements of the same duration can be compared well (for example, if you always set 15 minutes as the measurement duration in the settings), since a higher regularity of the curve and / or a higher amplitude but constant time results in a higher value.
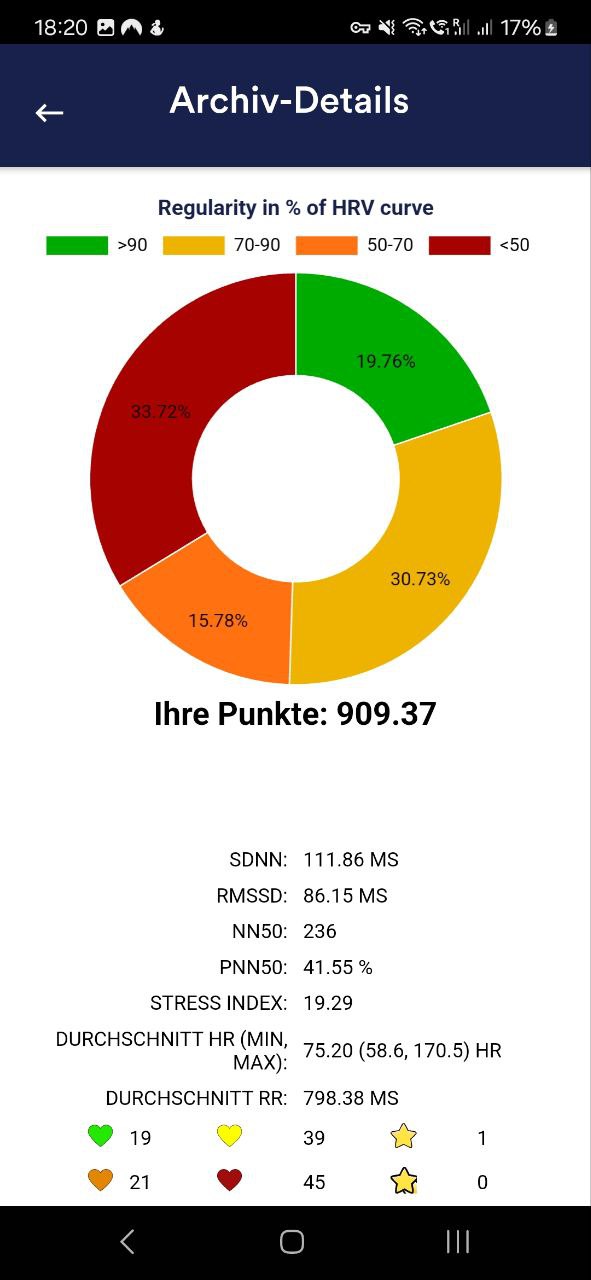
Regularity (developed specifically by Mindfield)
We also included the regularity as another value. This is also recorded by a formula developed by us and displayed in color (from a measurement duration of 5 minutes or more) in the overview after the measurement:
Attention: The colored coloring of the regularity does not correspond 100% with the color distribution in the pie chart as these are detected in different ways.
For the background coloring of the oscilloscope, a period of 20 seconds is taken and it is determined which regularity value is the most common color.
The pie chart, on the other hand, uses all the numeric regularity values of the entire session, with the percentages in red, yellow, orange, and green taken from them.
Enabling Analysis
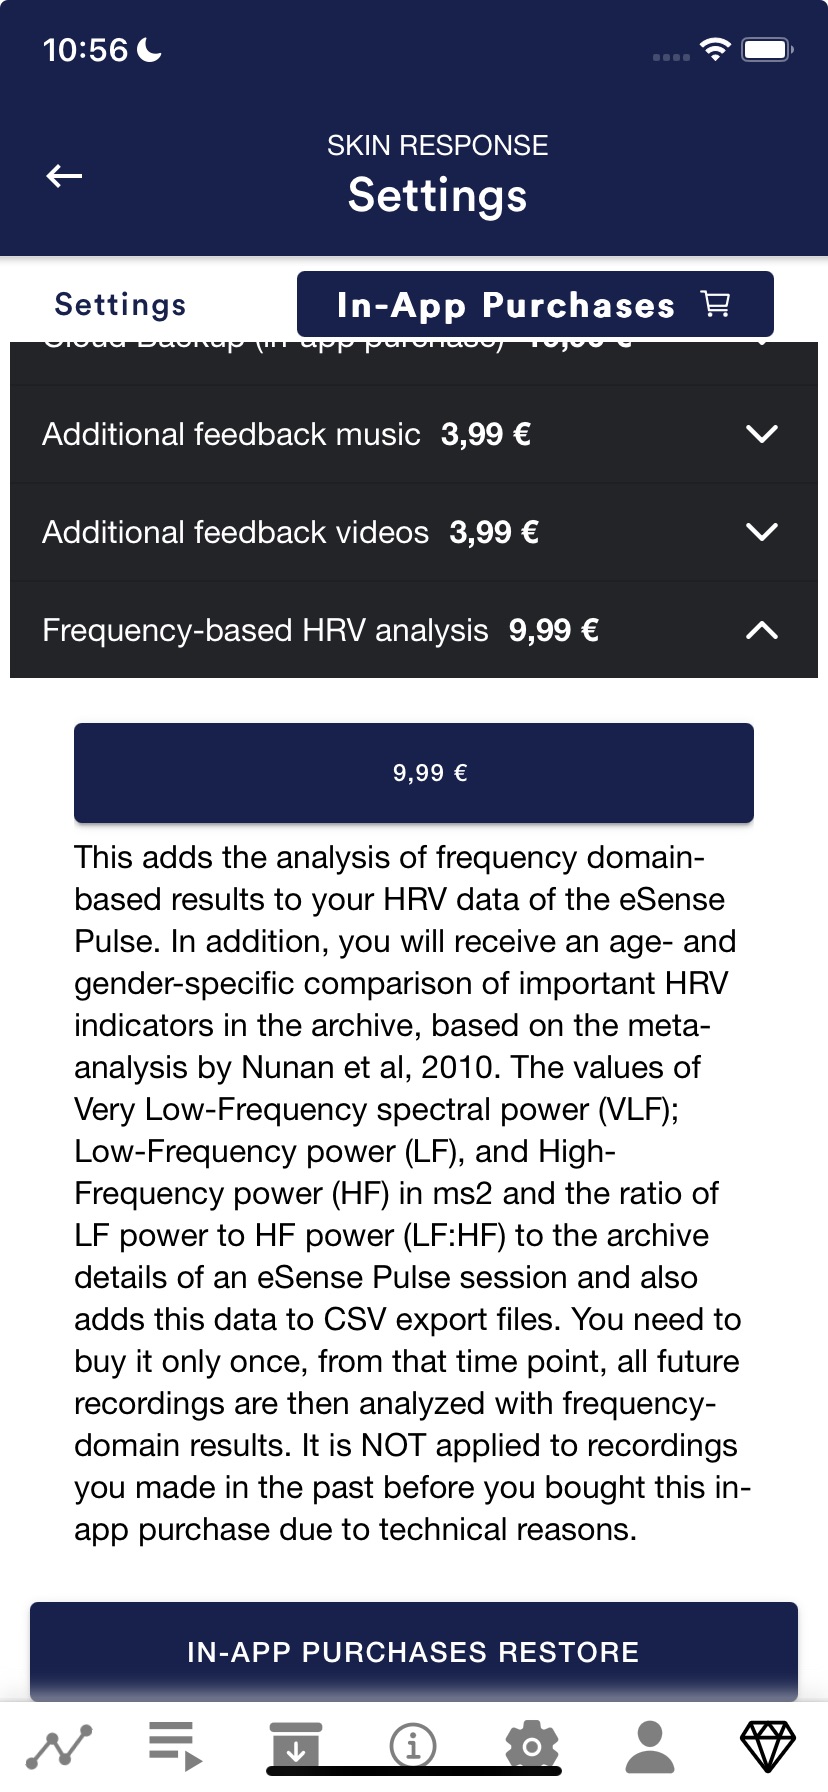
The frequency-based HRV analysis can be unlocked as an in-app purchase. However, due to technical reasons, it is not possible to apply this analysis retrospectively to measurements created before purchasing the feature.