Explanation of the individual measured values
Score (developed specifically by Mindfield)
For the Mindfield app, we have developed our own score system. This score, developed by us, should simply tell you how good your heart rate variability is with just one number.
Simply put, the better your heart rate variability, the higher this value.
In detail: The score is the sum of the regularity of the curve (in percent) and the amplitude (absolute value) divided by the rate of data from eSense Pulse (which transmits the last measured values via Bluetooth® every 200 ms) plus the previous score.
Therefore:

Whereby the time interval between Score and Score0 is just 200ms. If Regularity Percent << 90 then:

Thus, especially measurements of the same duration can be compared well (for example, if you always set 15 minutes as the measurement duration in the settings), since a higher regularity of the curve and / or a higher amplitude but constant time results in a higher value.
Regularity (developed specifically by Mindfield)
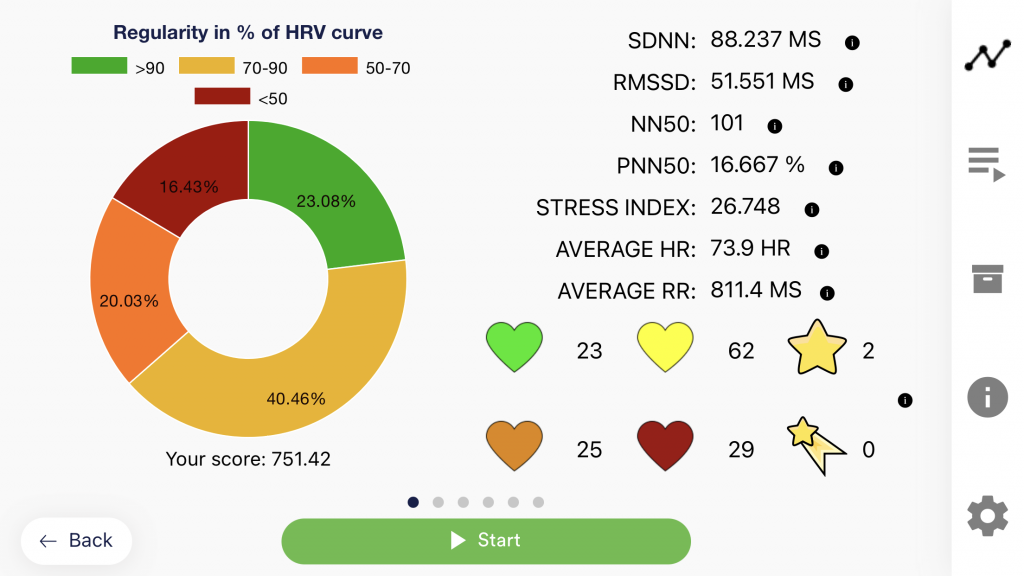
We also included the regularity as another value. This is also recorded by a formula developed by us and displayed in color (from a measurement duration of 5 minutes or more) in the overview after the measurement:
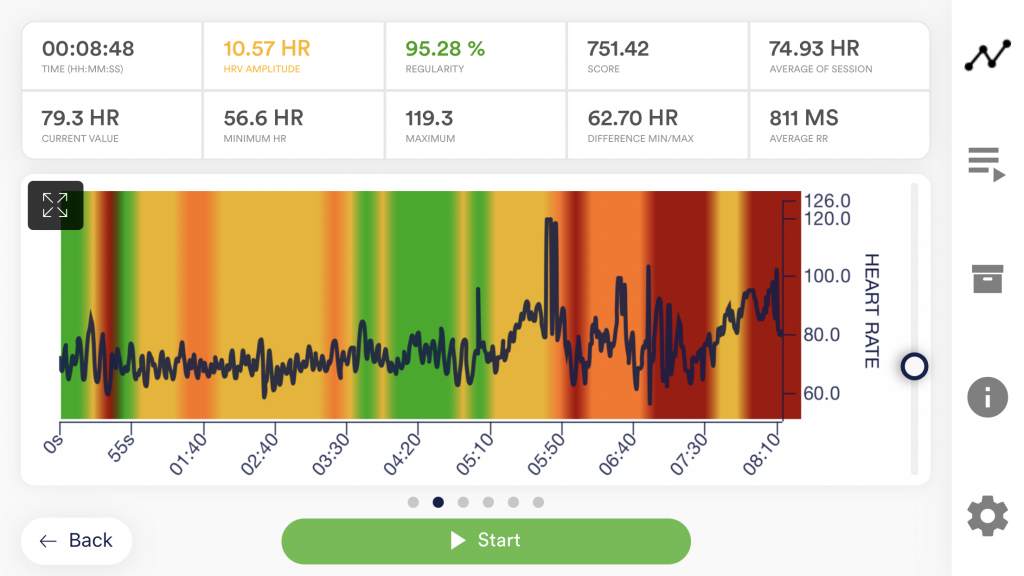
Attention: The colored coloring of the regularity does not correspond 100% with the color distribution in the pie chart as these are detected in different ways.
For the background coloring of the oscilloscope, a period of 20 seconds is taken and it is determined which regularity value is the most common color.
The pie chart, on the other hand, uses all the numeric regularity values of the entire session, with the percentages in red, yellow, orange, and green taken from them.
General HRV values
As an introduction to all measured values, we would like to briefly point out that the terms RR and NN mean the same thing but are used alternately in science and literature. The RR or NN interval is the distance between two heartbeats, in milliseconds.

Put simply, you train as much variability as possible between these intervals. The analysis of this distance data is possible in different parameters, which allow for different conclusions about the condition of your nervous system.
Time-based measured values
SDNN
(”Standard Deviation of the NN Interval“) is the standard deviation of the RR intervals. Put simply, how do the intervals deviate on average from the average of all intervals? Suppose you have a value of 68ms. This means that, on average, one heartbeat deviates from the next heartbeat by 68ms, which is 68ms earlier or later than the previous heartbeat. The higher this value, the higher your overall heart rate variability, which means the better your body can adapt to changes. You can also see how well Sympathetic and Parasympathetic work together.
RMSDD
(“Root Mean Square of Successive Differences”) is one of the most important parameters that provides information about the activity of the parasympathetic nervous system. It describes the short-term variability of the heartbeat, how strongly the heart rate changes from one heartbeat to the next. This is how the RMSSD value is calculated: The temporal difference of successive RR intervals is multiplied by itself to obtain only positive values. These intermediate values are summed and divided by the number of RR interval differences to obtain the mean value. The square root is drawn from the mean of these squared differences. The RMSDD is often referred to as the body’s ability to recover or the nervous system’s “brake.” The larger this number is, the better.
NN50
The number of pairs of RR intervals that are more than 50ms apart. The larger this number is, the better. However, only compare sessions of the same length and under the same conditions (e.g. sitting position, before/after sports, mornings/evenings, etc.).
pNN50
The percentage of pairs of RR intervals that are more than 50ms apart. The larger this number is, the better. However, only compare sessions of the same length and under the same conditions (e.g. sitting position, before/after sports, mornings/evenings, etc.).
Average RR
The average RR (also sometimes called RR interval or NN interval) is the average distance between two heartbeats. It is thus the reciprocal of the heart rate.
To get a feeling for this value, just think of the following three examples: If you have a resting pulse of 60 beats per minute, the average RR is exactly 1,000ms or one second (since one beat per second). If you are doing light to medium physical exertion at 120 beats per minute, then the RR is 500ms, or half a second (since two beats per second). If you’re working very hard to get your pulse up to 180 beats per second, the RR is 333ms or a third of a second (because three beats per second). For this value, there is no better or worse, the bigger or smaller. The only statement that can be made is that the higher the value at rest, the slower your resting pulse, which, for example, is a sign of fitness and a strong heart muscle in endurance athletes.
Stress Index
The exact formula: Stress index (SI) = AMo / 2Mo x MxDMn. Where AMo is the amplitude of the modal value and represents the percentage in comparison to all other RR intervals. Mo (in the formula 2Mo) is the modal value for the duration of a RR interval that has been measured the most often. MxDMn is the variability width, or in other words the difference between the maximum and minimum measured RR interval. Simply put, this formula calculates how adaptive the heart is or the value of the heart rate variability (HRV). A good relationship between the sympathetic and the parasympathetic reaches scores of 30 to 150 points. At 500 – 1000 points, limitations of adaptability are already assumed. Over 1000 points is an indication of a high level of exertion or stressful circumstances. Of course, it must also be noted that the SI depends on the respective situation. It makes a difference whether you are sitting quietly or exercising physically. However, at least in general terms, the lower the stress index (SI), the better. The more rigid and less variable the RR intervals are, the higher the stress index scores.
Frequency-based measured values (available as in-app-purchase)
In addition to the time parameters, we have also integrated frequency-based parameters into the analysis. A Fast Fourier Transformation is performed during each measurement from start to finish. You can observe the resulting spectrogram during the measurement in the last slide in landscape format.
VLF
(“Very low frequency”) is the HRV in the range from 0.0033 to 0.04 Hz. The VLF requires measurements with a length of at least 5 minutes. The VLF also differs from the LF and HF by a different characteristic. The changes in the VLF frequency band are visible longer. The VLF band is therefore the component for slow recovery.
LF
(”low frequency“) is the HRV in the range from 0.04 to 0.15 Hz. This allows vibrations in the range of about 10 seconds to be recorded. Here, the activity of the sympathetic nervous system is well reflected, with very slow breathing also in the upper range at 0.15 Hz of the parasympathetic nervous system. The higher this value is, the more distinctly the sympathetic nervous system is active in the center of gravity.
HF
(”high frequency“) is the HRV in the range from 0.15 to 0.40 Hz. This includes oscillations of about 2-7 seconds, in which the heart beat is often influenced by breathing (RSA = respiratory sinus arrhythmia). This also clearly shows the activity of the parasympathetic nervous system. The greater this value, with even, quiet breathing, the more pronounced the activity of the parasympathetic nervous system.
LF / HF ratio
LF / HF Ratio is the ratio between the HRV in the low frequency band (Low Frequency) to the HRV in the high frequency band (High Frequency). It thus expresses the sympathovagal balance. Since the LF band can be traced back to the sympathetic and the HF band to the parasympathetic, the LF / HF ratio indicates a possible dominance of the sympathetic or parasympathetic nervous system. If the LF / HF ratio is high, this indicates a dominance of the sympathetic nervous system. Typically this occurs in “fight or flight behavior”. A low LF / HF ratio indicates a dominance of the parasympathetic nervous system. This is a sign of relaxation and harmonious behavior.
Questions